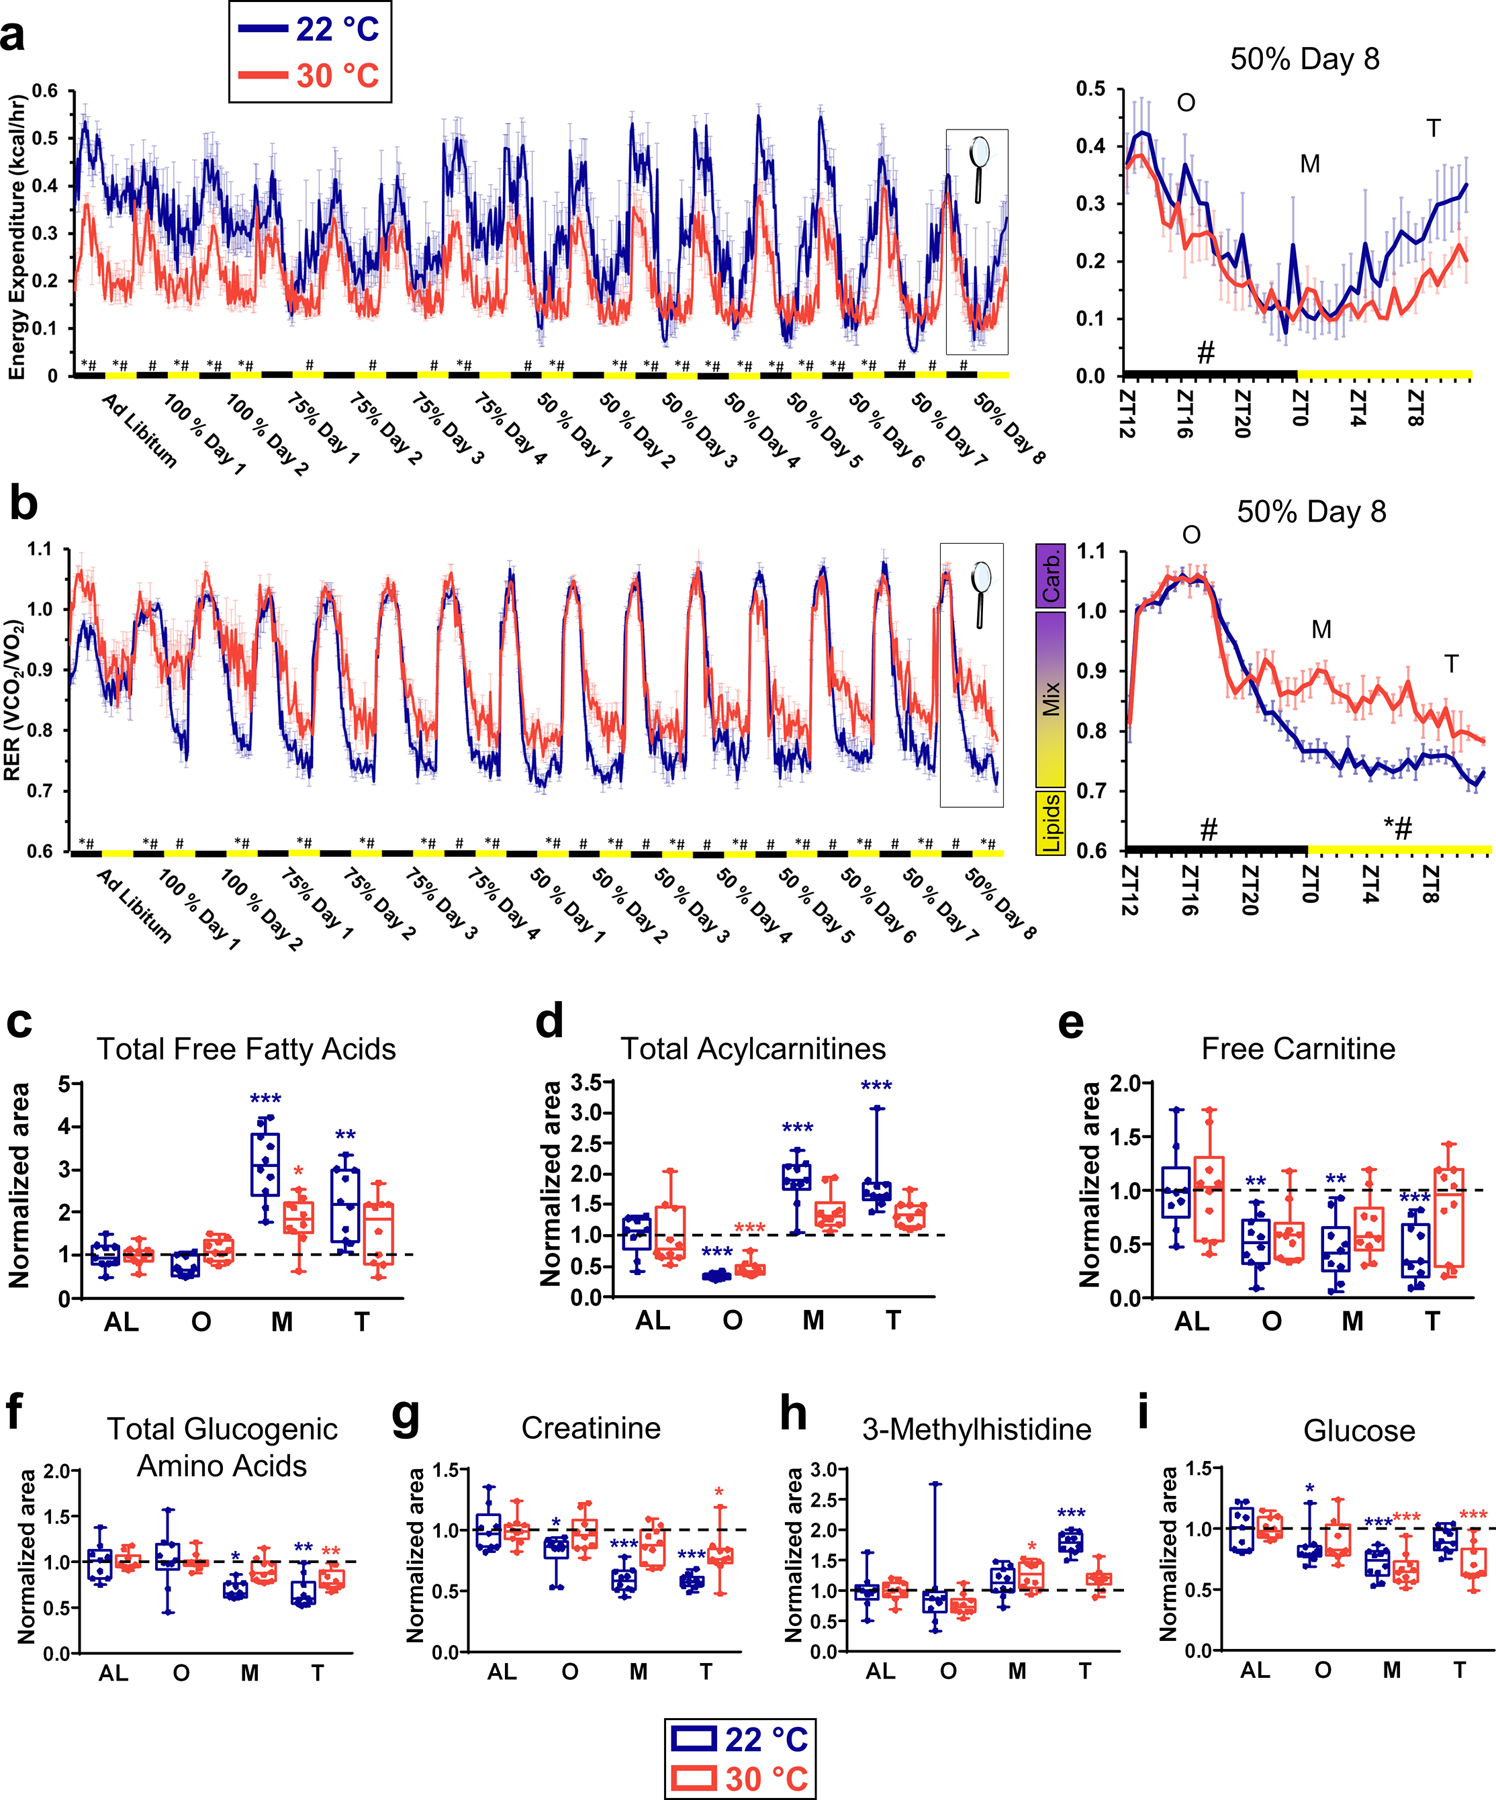
Figure 4. Temperature dictates fuel use and energy expenditure during calorie restriction.

(a) Energy expenditure of mice recorded every 30 minutes. Data at day 8 of CR with 50% of food (samples collection) is enlarged. N=6 mice for mice at 22 °C and N=4 mice at 30 °C. (b) Fuel use of mice measured by indirect calorimetry during the course of the calorie restriction. The respiratory exchange ratio (RER) was recorded every 30 minutes. RER>1.0 indicates an exclusive use of carbohydrates as fuel; RER<0.7 indicates an exclusive use of lipids as fuel; and 0.7<RER<1.0 indicates a mixed use of carbohydrates and lipids as source of energy. Data at day 8 of CR with 50% of food (samples collection) is enlarged. N=6 mice for mice at 22 °C and N=4 mice at 30 °C. (c) Total free fatty acids in plasma calculated as the weighted sum of all free fatty acids. (d) Total acylcarnitines in plasma calculated as the weighted sum of all acylcarnitines. (e) Free carnitine levels measured in plasma. (f) Total glucogenic amino acids in plasma calculated as the weighted sum of all glucogenic amino acids found in the data sets (Ala, Arg, Asn, Asp, Glu, Gln, His, Met, Pro, Ser, Val, Ile, Phe, Trp & Tyr. See Data File S5). (g) Creatinine levels in plasma. (h) 3-methylhistidine levels in plasma. (i) Glucose levels in plasma. N=10 mice for each group, except for AL at 22 °C (N=9) for C-I. For statistical comparisons in (a, b), data were grouped by day and activity period, establishing the activity (light OFF, ZT12–23, black rectangles) and sleeping periods (lights ON, ZT0–12, yellow rectangles) as whole units for statistical analysis. Repeated measures 2-way ANOVA followed by Bonferroni’s multiple comparison correction was used to analyze differences between ambient temperature groups on RER and energy expenditure. *p<0.05, 2-way ANOVA means are significantly different; #p<0.05, significant difference between specific timepoints determined by Bonferroni’s multiple comparison test. In (c-i), data was normalized using the ad libitum (AL) values as reference for both temperatures. Data were presented as box-and-whisker plots showing the data from all mice analyzed. Outliers were not removed. *p<0.05; **p<0.01; ***p<0.001 determined by a one-way ANOVA followed by a Tukey’s HSD test, using AL data as reference for O, M and T time points.
