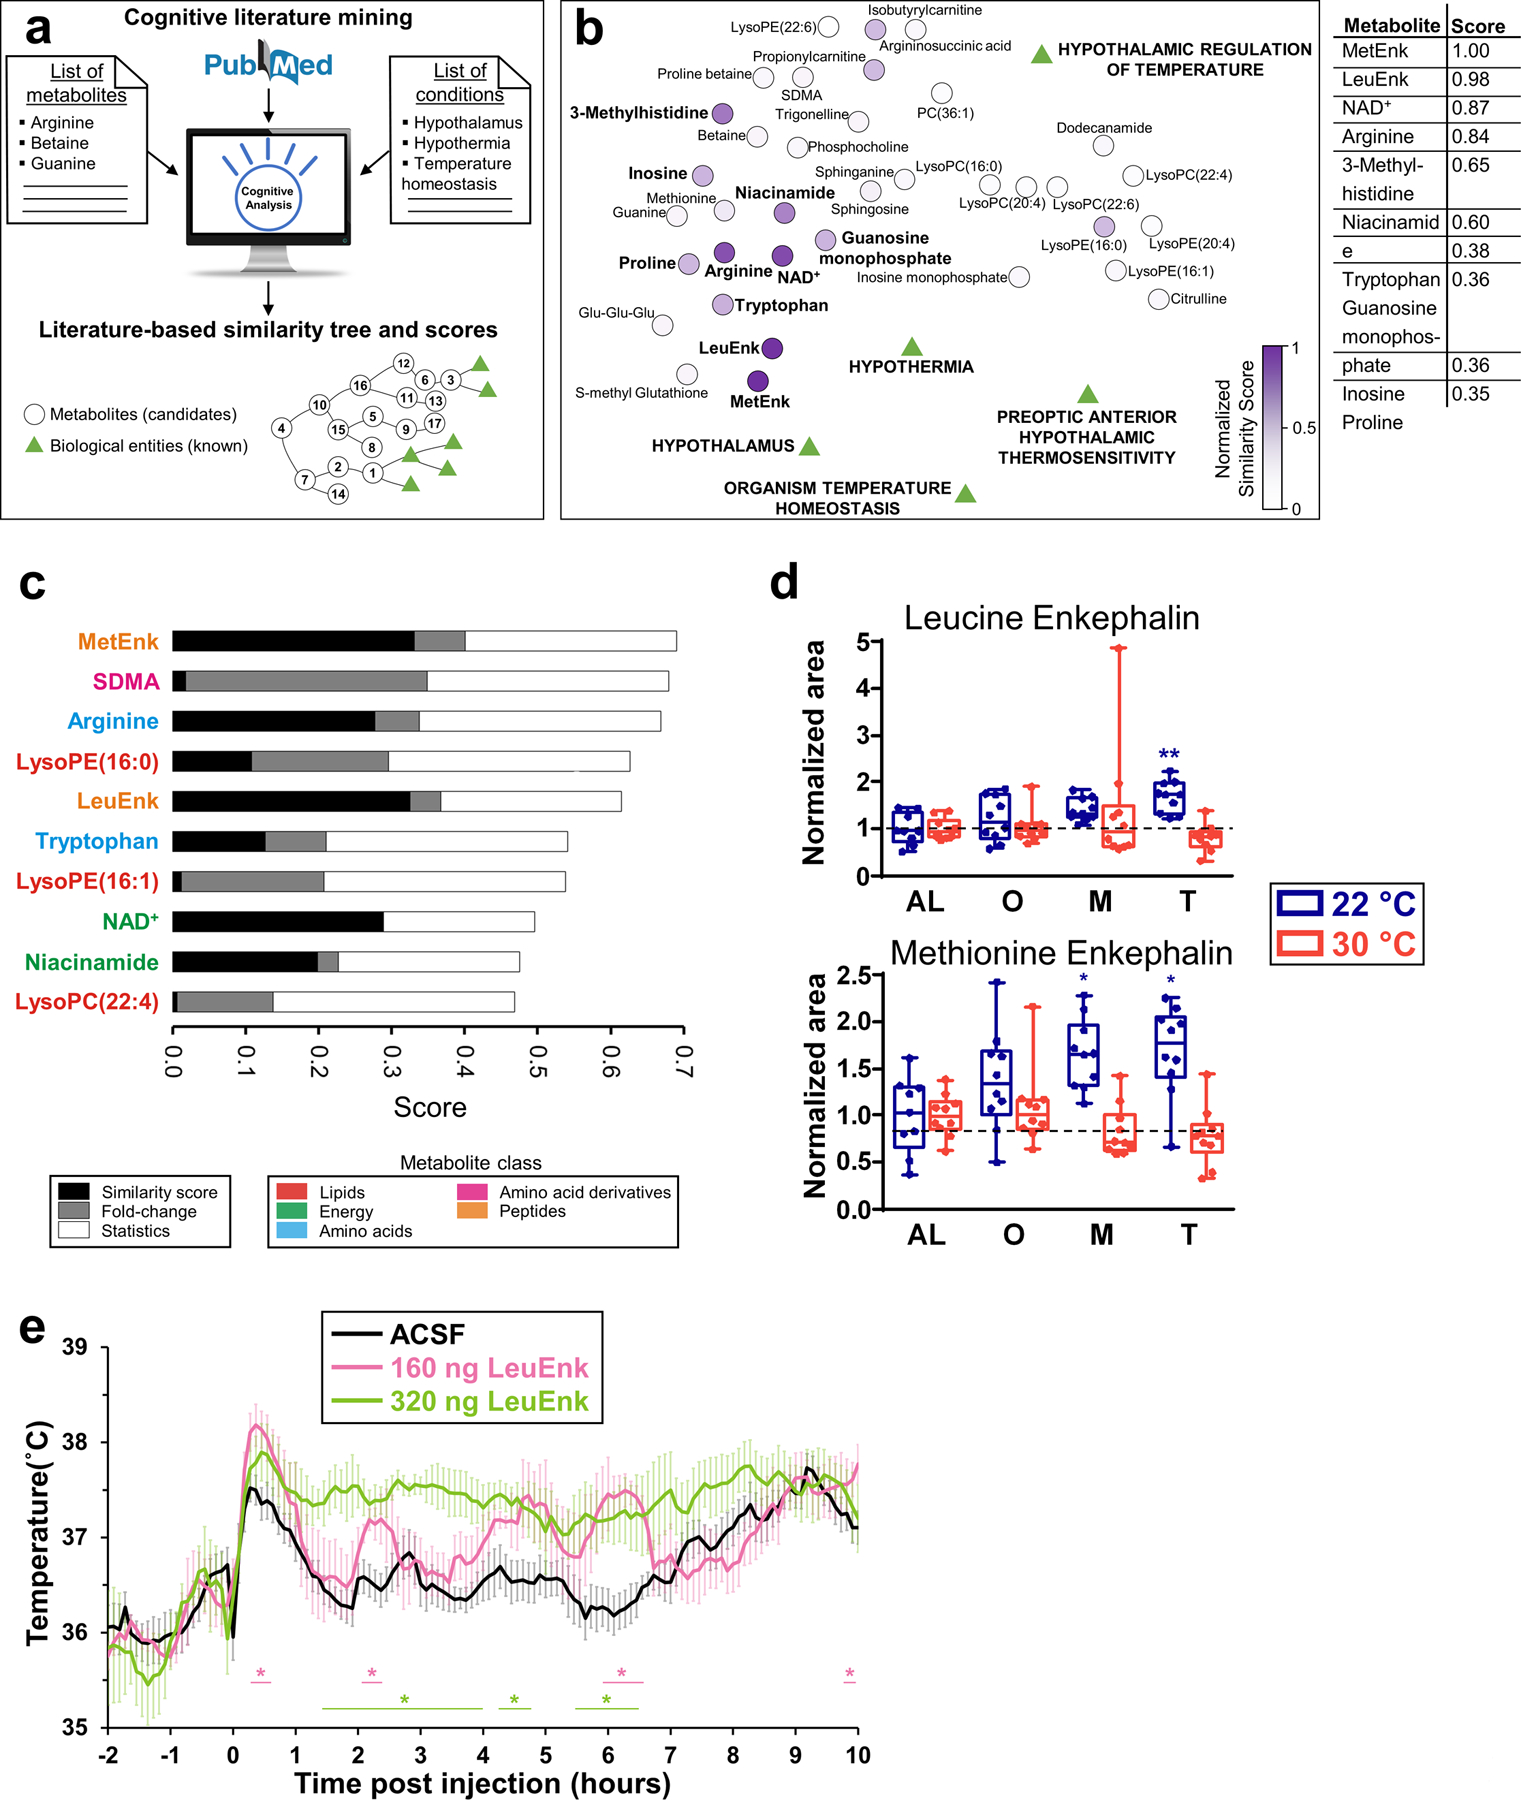
Figure 5. Cognitive computing-guided prioritization of hypothalamic metabolites.

(a) The cognitive predictive analysis used NLP of scientific literature to find relationships between candidate metabolites and known biological conditions, ranking metabolites attending to the number of literature-based connections. (b) Distance network of known biological conditions and candidate metabolites are depicted as a function of the literature-based relationships found between them, calculated in the similarity matrix. Medline abstracts were used to search relationships. The closer a metabolite is to the biological conditions, the higher is ranked. The normalized similarity score is plotted as a heatmap. LysoPC(15:0) was not ranked because no documents were found. (c) Two more rankings based on metabolite statistics and fold-change during CR for both temperatures. The similarity score was averaged with these two scores. (d) Leucine enkephalin and methionine enkephalin levels measured in the hypothalamus. N=10 mice for each group, except for AL at 22 °C (N=9). (e) Tb profile of C57BL6 mice upon intracerebroventricular administration of multiple doses of leucine enkephalin or vehicle (artificial cerebrospinal fluid) during ad libitum feeding at time 0. N=4 mice for each group. Data in (d) was normalized using the ad libitum (AL) values as reference for both temperatures. Data were presented as box-and-whisker plots showing the data from all mice analyzed. Outliers were not removed. *p<0.05; **p<0.01; ***p<0.001 determined by a one-way ANOVA model by a Tukey’s HSD test, using AL data as reference for O, M and T time points. In (e), *p<0.05, determined by repeated measures 2-way ANOVA followed by Bonferroni’s multiple comparisons test.
