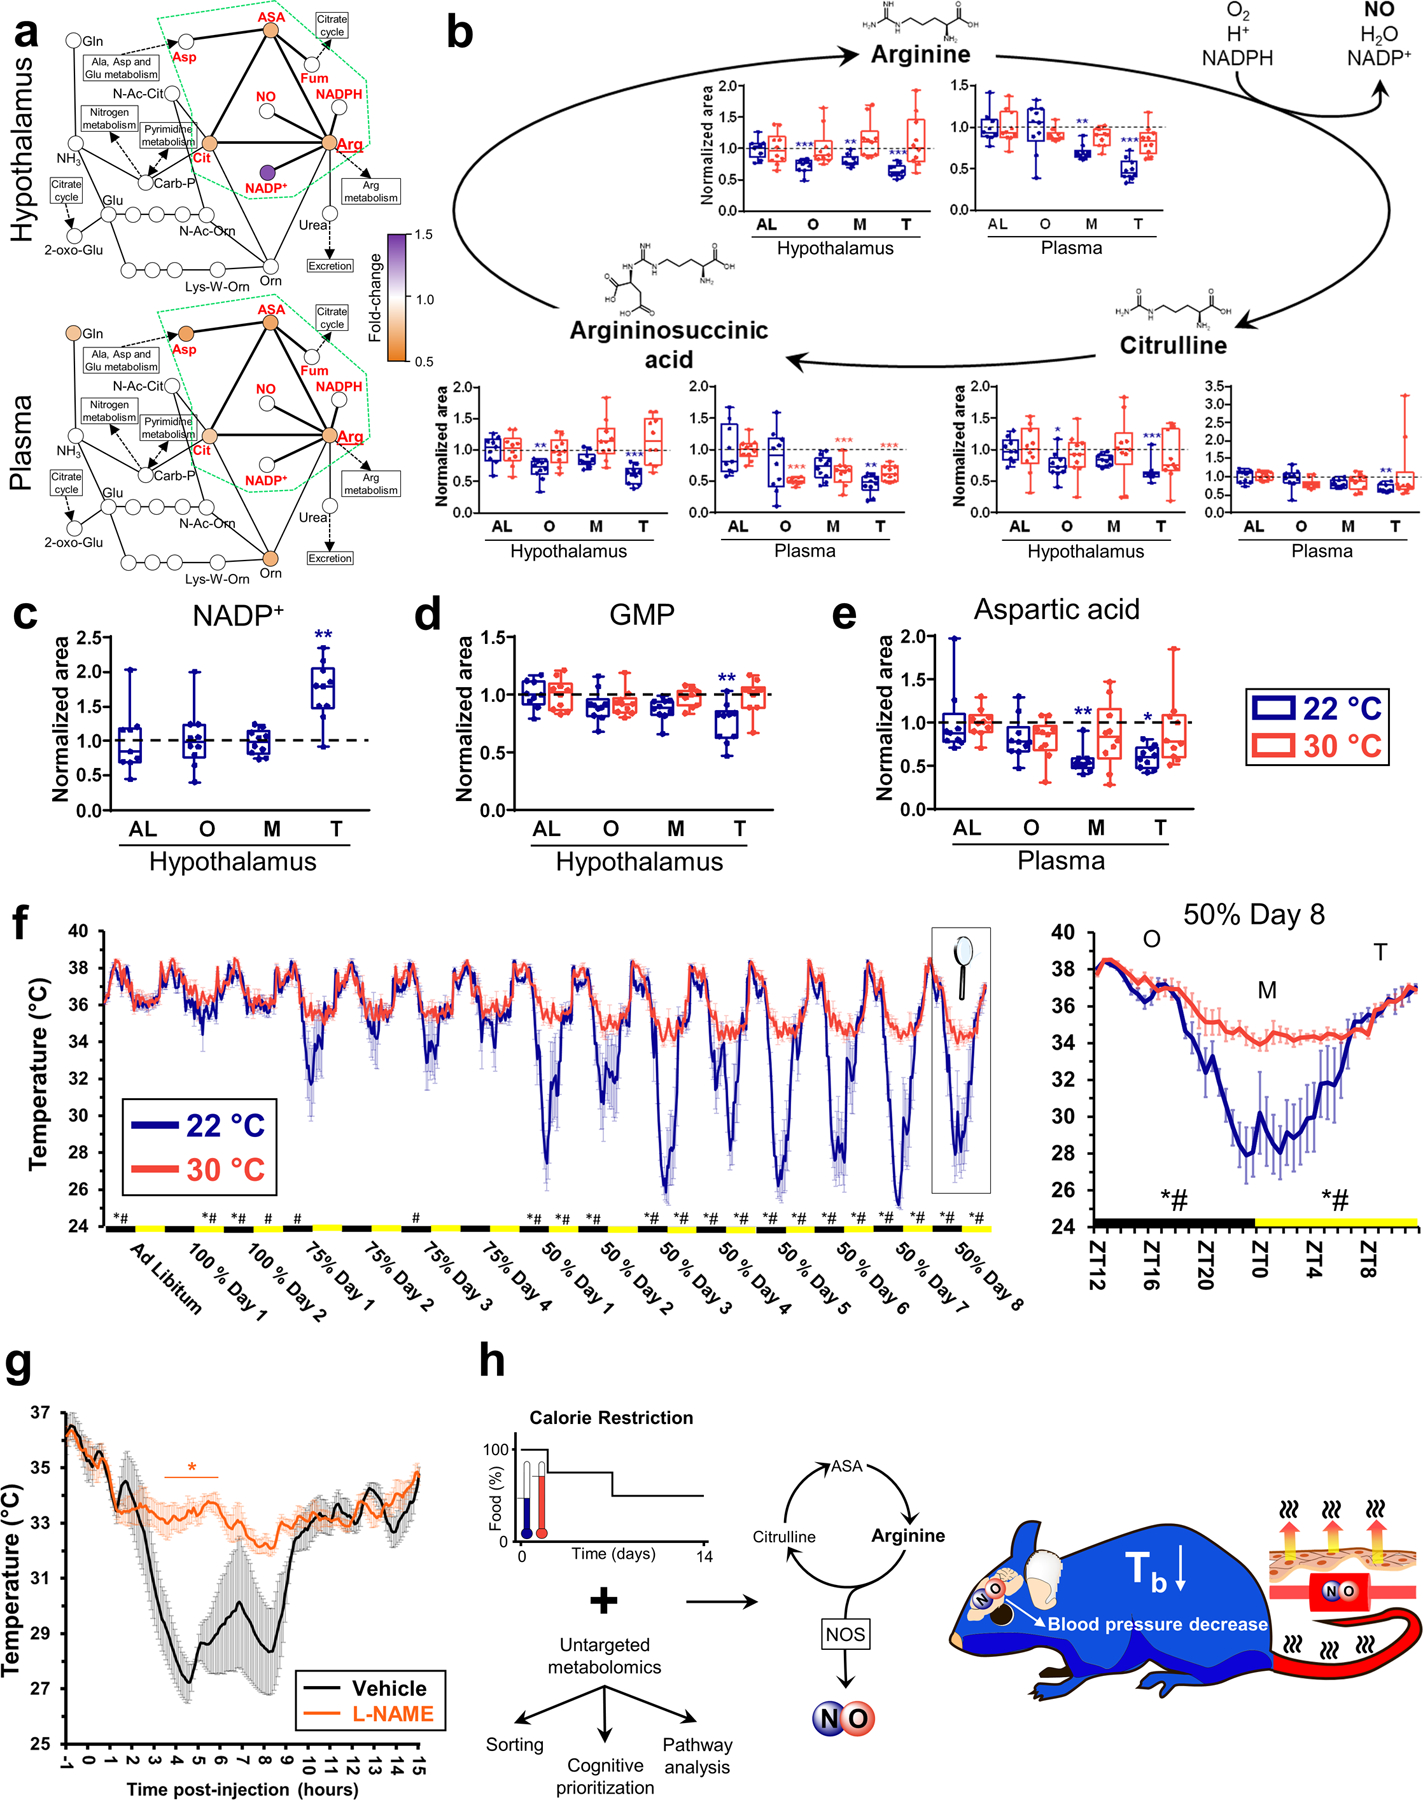
Figure 6. The citrulline-nitric oxide plays a pivotal role in the hypothermic response to calorie restriction.

(a) Several metabolites of the urea cycle are altered following calorie restriction in both the hypothalamus and plasma, especially those of the citrulline-nitric oxide (NO) cycle (contained within the green dashed area). Fold-change shown corresponds to an average of O, M &T data compared to AL at 22°C. (b) Citrulline-NO cycle main metabolites measured in the hypothalamus and plasma. (c) NADP+ levels in the hypothalamus. (d) Guanosine monophosphate levels in the hypothalamus. (e) Aspartic acid levels measured in plasma. N=10 mice for each group, except for AL at 22 °C (N=9) for B to E. (f) Core body temperature was continuously recorded by a rectal temperature probe. Data at day 8 of CR with 50% of food (samples collection) is enlarged. N=6 mice for mice at 22 °C and N=4 mice at 30 °C. (g) Pharmacological inhibition of nitric oxide synthase during CR. Temperature profile of C57BL6 mice on 50% CR was measured after subcutaneous injection of 50 mg/kg L-NAME (NG-nitro-L-arginine methyl ester) or vehicle. Injections were performed at time 0, which is 5 to 6 hours before the hypothermic response starts (ZT18-ZT19). Both mice injected with vehicle and L-NAME ate the full amount of food provided during a one-hour window starting at ZT12. N=4 mice for vehicle, N=5 mice for L-NAME. (h) Proposed model. Calorie restriction activates the citrulline-NO cycle to generate NO at both the local and systemic levels, helping mice housed at room temperature to lose heat and enter in hypothermia. In (b-e), data were normalized using the ad libitum (AL) values as reference for both temperatures. Data were presented as box-and-whisker plots showing the data from all mice analyzed. Outliers were not removed. *p<0.05; **p<0.01; ***p<0.001 determined by a one-way ANOVA model by a Tukey’s HSD test, using AL data as reference for O, M and T time points. For statistical comparisons, data in (f) were grouped by day and activity period, establishing the activity (light OFF, ZT12–23, black rectangles) and sleeping periods (lights ON, ZT0–12, yellow rectangles) as whole units for statistical analysis. Repeated measures 2-way ANOVA followed by Bonferroni’s multiple comparison correction was used to analyze differences between ambient temperature groups on RER and energy expenditure. *p<0.05, 2-way ANOVA means are significantly different; #p<0.05, significant difference between specific timepoints determined by Bonferroni’s multiple comparison test. In (g), *p<0.05, determined by repeated measures 2-way ANOVA followed by Bonferroni’s multiple comparisons test.
