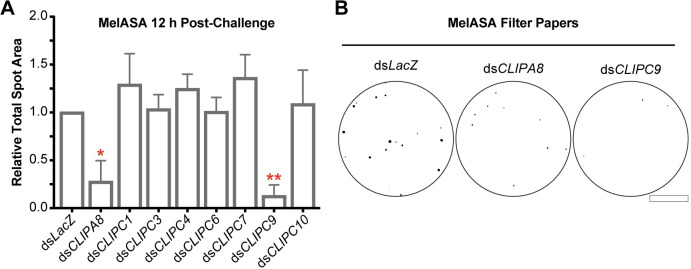
Fig 3. MelASA links CLIPC9 to the melanization immune response.
(A) MelASA analysis of screened candidates 12 h post-E. coli injection. Data are compiled from one Standard and two Mini-MelASAs. Mean relative total spot areas were compared to control with one sample t-tests. Error bars are ± SD. (B) Representative Mini-MelASA filter papers from control, CLIPA8, and CLIPC9 knockdowns. Scale bar is 1.3 cm. Asterisks denote statistical significance (*p ≤ 0.05, **p ≤ 0.01). Data are from independent biological replicates.

