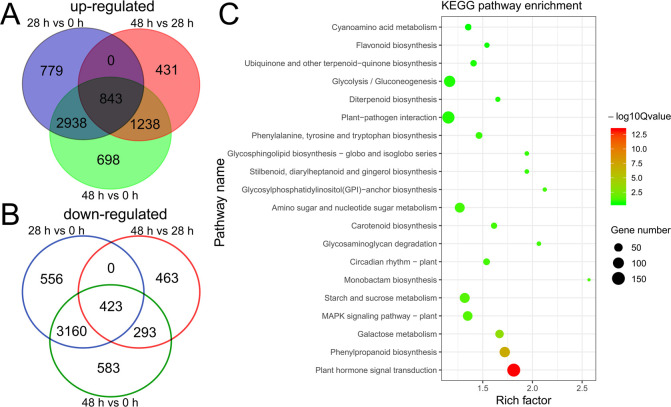
Fig 4. Differential gene expressions during the germination process of A. paniculata seeds treated with plasma.
(A) Venn diagram of up-regulated DEG numbers in three germination stages. (B) Venn diagram of down-regulated DEG numbers in three germination stages. (C) KEGG pathway enrichment map of differentially expressed genes. The bubble plot in R-3.2.1 for Windows was used to draw this map.

