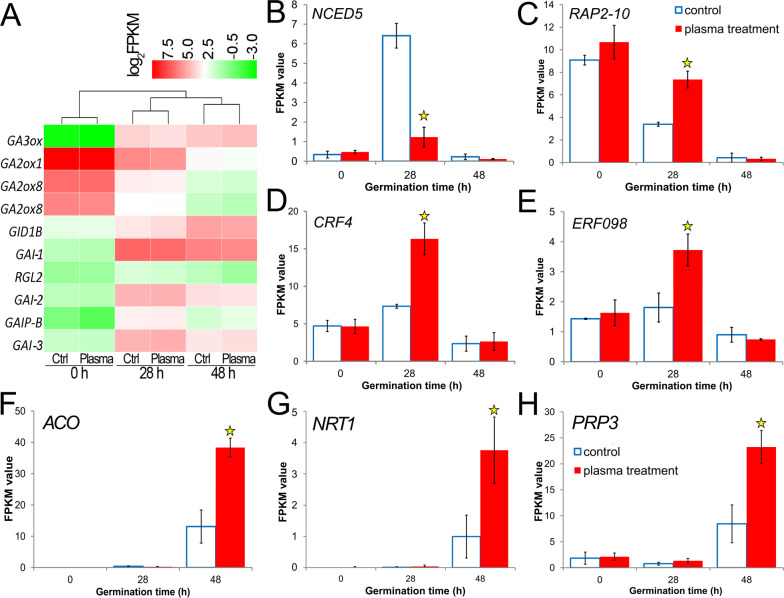
Fig 5. Differential expressions of genes related to GA, ABA, and ethylene signaling between control and plasma-treated groups.
(A) Heatmap of expression changes of GA synthesis or signal-related genes. Pheatmap in R-3.2.1 for Windows was used to draw this map. (B-H) Bar charts of genes expression changes related to ABA and ethylene syntheses, ERFs signal or other hormones during seed germination. Replications = 3. Data are shown as the mean ± SD. Asterisk represents a significant difference, FDR≤0.01.

