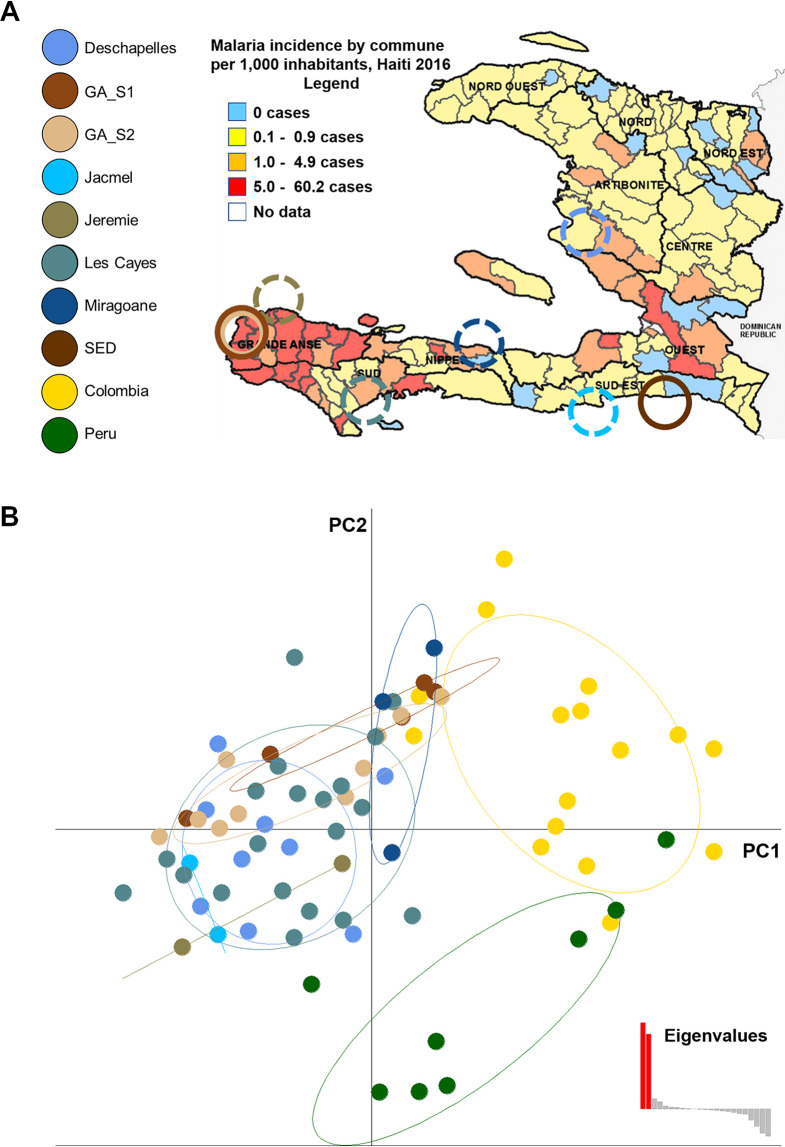
FIG 1.
Clustering analyses on 24 SNP markers. (A) Map of Haiti and sampling sites. Incidence data are from reference 74. Dotted lines indicate origins of samples from reference 14; solid lines indicate origins of our samples, for which whole-genome data are available. (B) sPCA using 24 SNP barcodes from reference 14; following original paper filtering protocol for consistency, one of the isolates that were filtered out was our sample from the Sud-Est Department.

