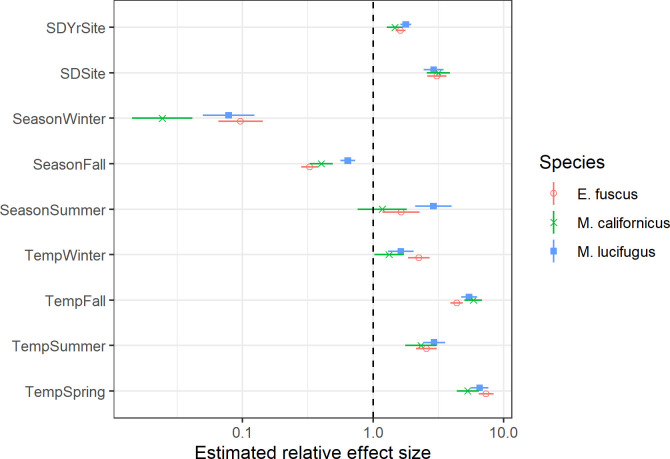
Fig 5. Model estimates of relative effect sizes for selected fixed and random effects from three species-specific models.
Results for each species are shown with different colors and symbols. Parameters with a ‘Temp’ prefix show the expected difference in response for a 5°C temperature increase by season. Parameters with a ‘Season’ prefix show the expected difference from Spring activity at a constant temperature of 7.3°C. Parameters with a ‘SD’ prefix represent model random effects and show the estimated 1 SD variation in mean response among sites and among years within a site. Horizontal lines show +/- 1 standard error bounds. The vertical dashed line at 1.0 indicates no relative difference in bat activity.

