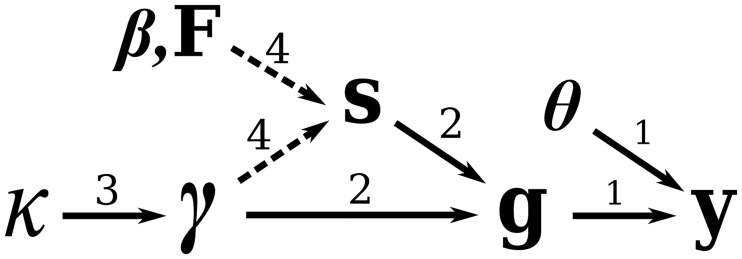
Fig 2. Dependency graph for the phylodynamic model parameters and data.
Dependencies labeled 1 are explored in section, those labeled 2 are explored in section, those labeled 3 are explored in section, and those labeled 4 are explored in section. The dashed lines between and s represent preferential sampling.

