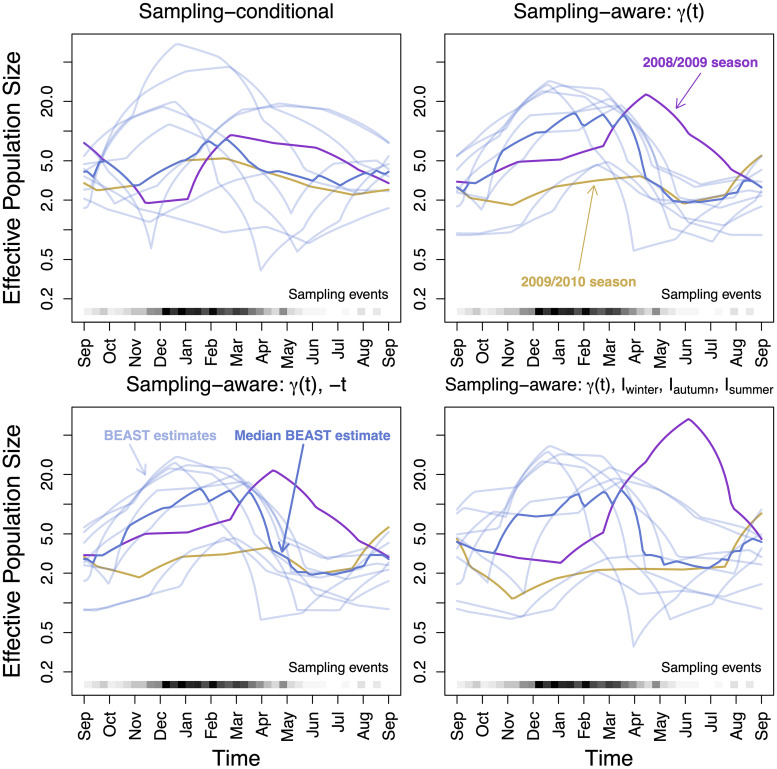
Fig 6. Effective population size seasonal overlay for the USA and Canada influenza dataset.
The light blue lines are the pointwise posterior estimates for each year, and the dark blue line is the median annual estimate. Upper left: Sampling-conditional posterior. Upper right: Sampling-aware posterior with only log-effective population size γ(t) informing the sampling time model. Lower left: Sampling- and covariate-aware posterior, with γ(t) and −t. Lower right: Sampling- and covariate-aware posterior, with γ(t) and seasonal indicators Iwinter, Iautumn, Isummer.

