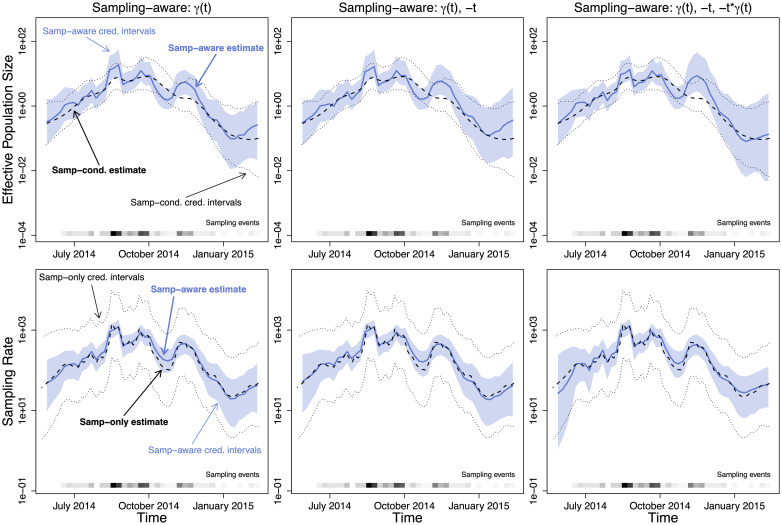
Fig 8. Effective population size and sampling rate reconstructions for the Liberia Ebola dataset.
Upper row: Dashed lines and dotted black lines are the pointwise posterior effective population size estimates and credible intervals of the sampling-conditional model. The blue lines and the light blue regions are the pointwise posterior effective population size estimates and credible intervals of that column’s sampling-aware model. Lower row: Dashed lines and dotted black lines are the pointwise posterior sampling rate estimates and credible intervals of a nonparametric sampling-time-only model. The blue lines and the light blue regions are the pointwise posterior sampling rate estimates and credible intervals of that column’s sampling-aware model.

