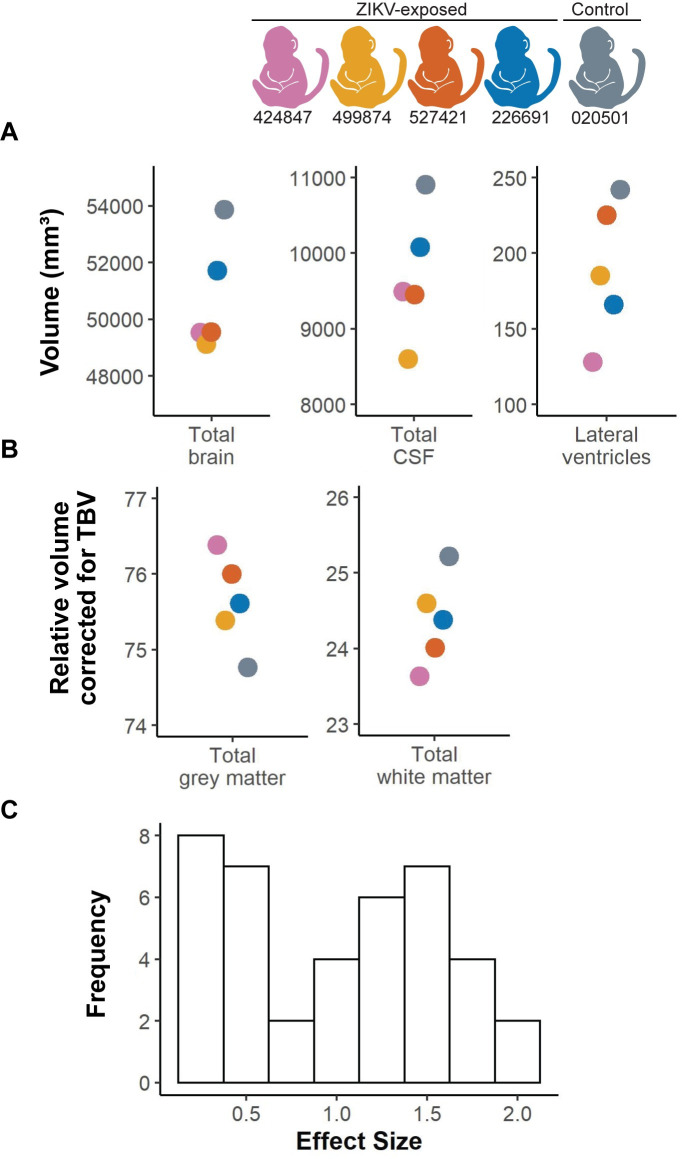
Fig 11. Volumetric brain analysis and effect sizes.
(A) Structural MRI measurements in cubic millimeters for total brain volume (TBV), lateral ventricles and cerebrospinal fluid (CSF). (B) Grey matter and white matter specific areas corrected for TBV in all infants. (C) A histogram illustrates the distribution of effect for entire brain regions and regions corrected by TBV (tissue type, cortical regions, subcortical regions).

