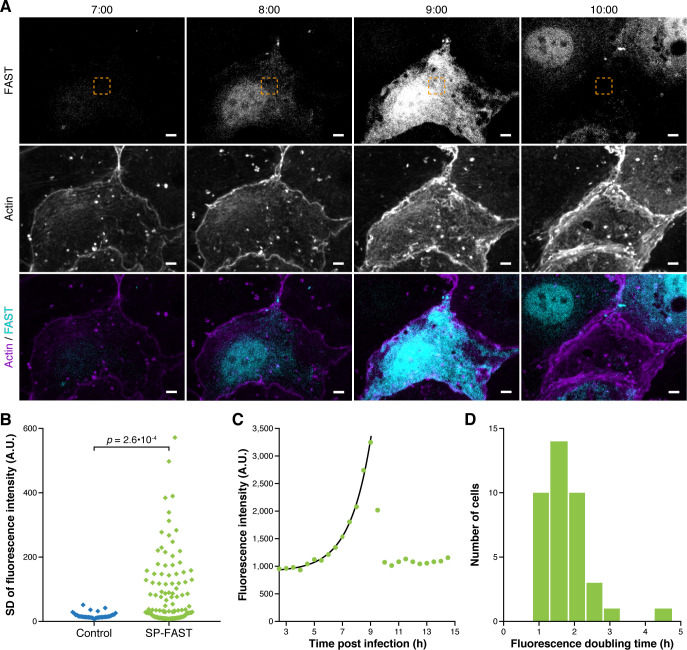
Fig 2. Secreted FAST accumulates exponentially in the cytoplasm of infected cells.
(A) Spinning disk fluorescence microscopy images of LoVo cells infected with Lm secreting SP-FAST (cyan) at different time-points post-infection (h:min). The actin cytoskeleton (purple) was labelled with SiR-actin. The area where FAST fluorescence intensity was measured for graph (C) is boxed in orange. Scale bars, 5 μm. (B) Dispersion of fluorescence intensities. Fluorescence emission at 562 nm (FAST:HBR-3,5DM channel) was quantified over time within a region of fixed area in cells infected by Lm strains expressing either SP-FAST (in green, n = 127) or mCherry as a negative control (in blue, n = 35). As an indicator of the amplitude of fluorescence accumulation, the standard deviation of fluorescence intensity over time was plotted for each cell. A.U., arbitrary units. The p-value represents the result of a two-tailed Mann-Whitney non-parametric test. (C) Intensity of FAST signals measured over time in the region boxed in yellow in (A). The black line displays an exponential fit obtained over the ascending part of the curve (green dots). (D) Distribution of the doubling time of FAST fluorescence signals among the population of infected cells (n = 39). Source data are provided in S4 Table.

