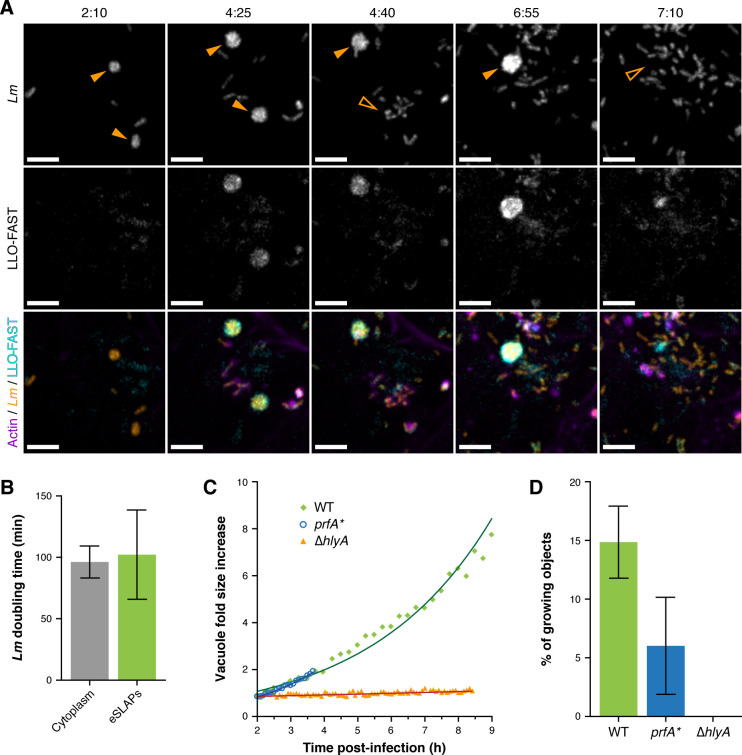
Fig 4. Listeria monocytogenes replicates inside long-term vacuoles decorated with LLO.
(A) Spinning disk microscopy images of LoVo cells infected with Lm expressing both LLO-FAST (in cyan) and mCherry (in orange) at several time-points post-infection. SiR-actin staining is shown in purple. eSLAPs are indicated with solid orange arrowheads; their past location is pointed with open arrowheads after their rupture. Scale bars, 5 μm; timescale, h:min. (B) Doubling times of Lm expressing mCherry in the cytoplasm (grey, n = 7) or in eSLAPs (green, n = 18) in infected LoVo cells. (C) Quantification of the increase in volume of eSLAPs, and thus of the growth of the bacteria they contain, for WT (green), prfA* (blue) or ΔhlyA (orange) Lm strains in infected LoVo cells. (D) Proportion of intracellular Lm that multiplied inside eSLAPs during a time-course of 8 h. Plotted values represent the ratio of the number of eSLAPs that had at least doubled in volume over the time course to the number of segmented mCherry objects (i.e. cytoplasmic or intravacuolar bacteria, isolated or in clusters) at the beginning of the observation (2 h p.i). Green, WT strain (n = 134); blue, prfA* strain (n = 33); orange (null), ΔhlyA strain (n = 113). Source data are provided in S6 Table.

