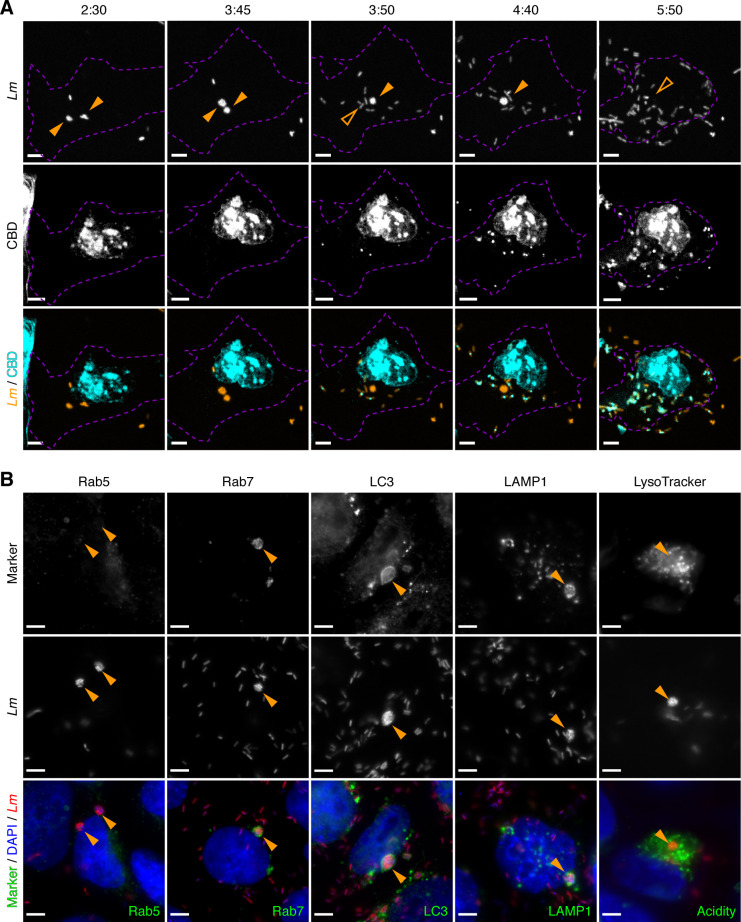
Fig 5. Listeria eSLAPs derive from internalisation vacuoles and display typical markers of LC3-associated phagocytosis.
(A) Differential labelling by YFP-CBD of the cytosolic versus intravacuolar populations of intracellular bacteria. LoVo cells were transfected with pEYFP-CBD (in cyan) 24 h before being infected with Lm expressing mCherry (in orange), then imaged at different time-points post infection. eSLAPs are indicated with solid orange arrowheads; their past location is pointed with open arrowheads after their rupture. The cell outline is indicated with purple dashed lines. Note that a strong non-specific YFP-CBD signal is also detected in the cell nucleus. Timescale, h:min. (B) Rab5, Rab7, LC3 and LAMP1 (in green) were detected by immunofluorescence in LoVo cells infected for 3 h with mCherry-expressing bacteria (in red). For acidity staining, LoVo cells infected for 2 h with eGFP-expressing bacteria (in red) were stained with LysoTracker Deep Red (in green), and observed 1 h afterwards on an inverted spinning disk microscope. Orange arrowheads point to representative eSLAPs. (A, B) Scale bars, 5 μm. Quantitative analyses of these experiments are provided as S11 Fig.

