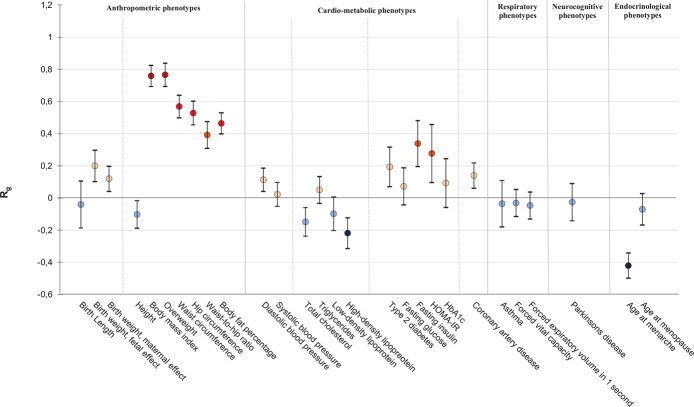
Fig 3. Genome-wide genetic correlations between childhood BMI and adult traits and diseases.
On the x-axis the traits and diseases are shown. On the y-axis the genetic correlations (Rg) and corresponding standard errors, indicated by error bars, between childhood BMI and each trait were shown, estimated by LD score regression. The genetic correlation estimates (Rg) are colored according to their intensity and direction. Red indicates positive correlation, blue indicates negative correlation. References can be found in S11 Table.

