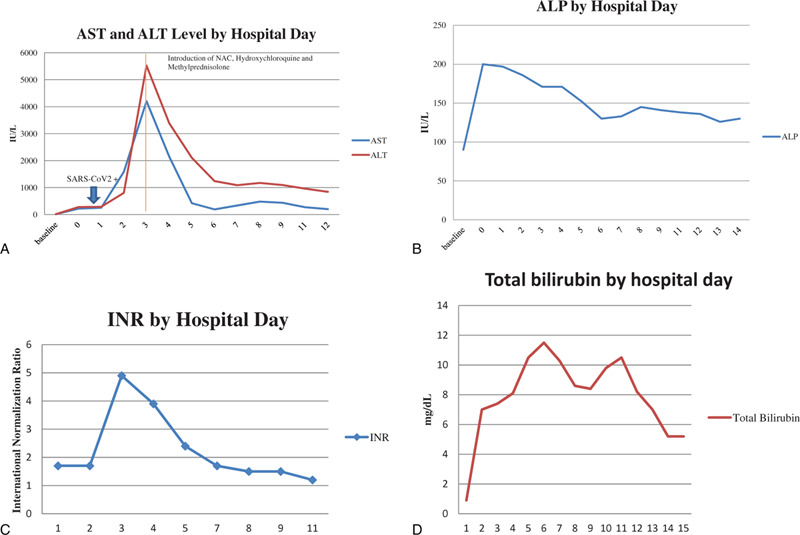
Figure 1.

A: Transaminase Levels by Hospital Day- AST and ALT, Arrow indicating SARS-CoV2+ by PCR on Hospital day 0. Line indicates induction of NAC, hydroxychloroquine and methylprednisolone on hospital day 3. B: Transaminase Levels by Hospital Day- ALP. C: INR Levels by Hospital Day. D: Total Bilirubin levels in mg/dL by hospital day.
