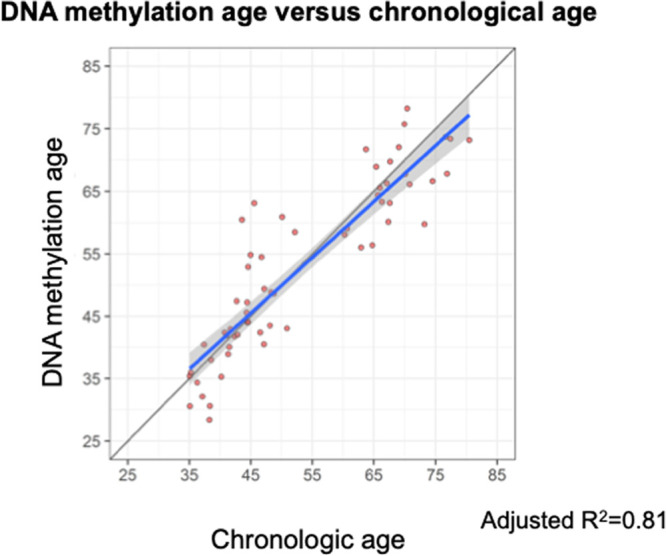
FIGURE 1.

Linear regression of DNAm age on chronological age. DNAm age was calculated from the 292 CpG sites using BMIQ normalization. The gray line represents a diagonal line of Y = X, while the blue represents the regression line. The gray shade indicates the 95% prediction interval. DNAm, DNA methylation; BMIQ, beta-mixture quantile.
