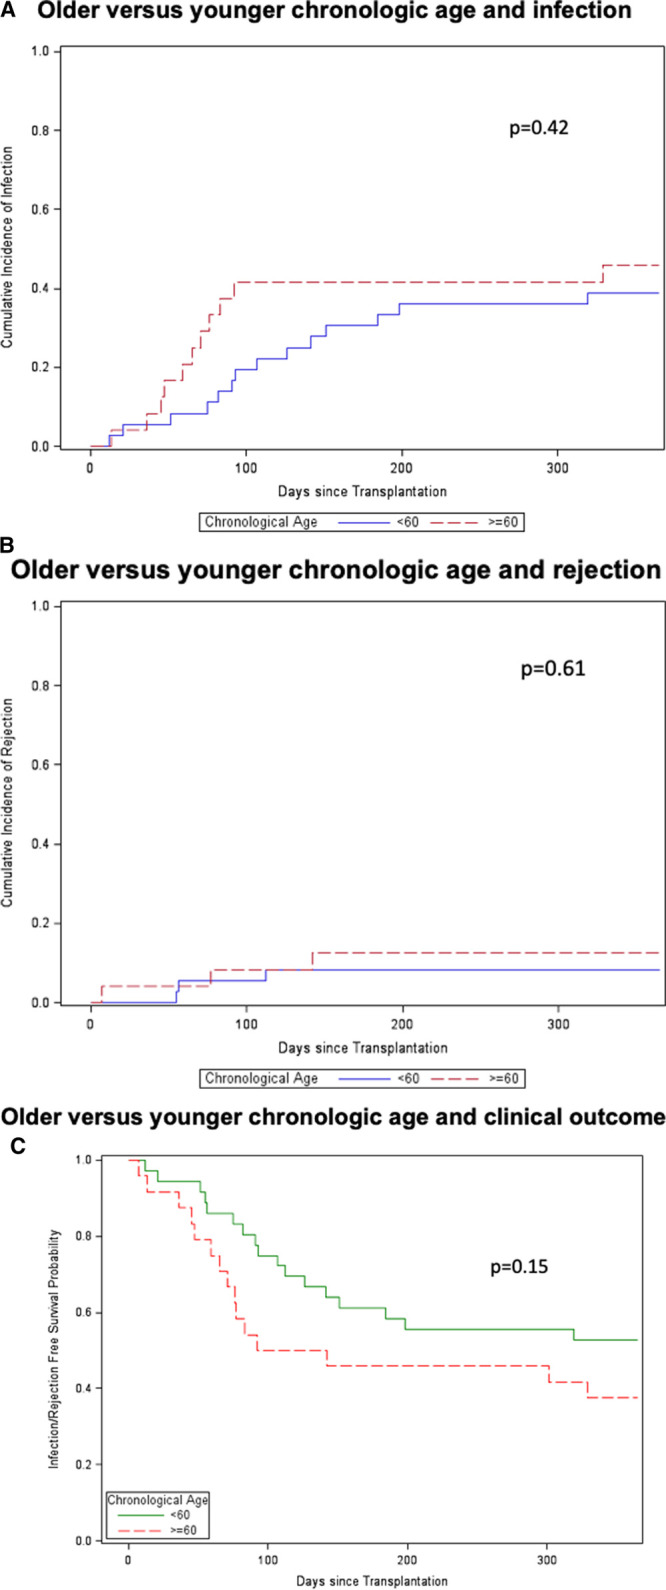
FIGURE 3.

Older compared with younger DNA chronological age and clinical outcomes. Time to event analysis was performed for older (≥60 y; n = 15) vs younger (<60; n = 45) chronological age groups for infection (P = 0.42) (A), rejection (P = 0.61) (B), and competing outcomes of infection or rejection (P = 0.15) (C). Older patients are shown by dotted-red line and younger patients are shown by solid blue or green line. Statistical analysis for competing events was performed using Gray’s test.
