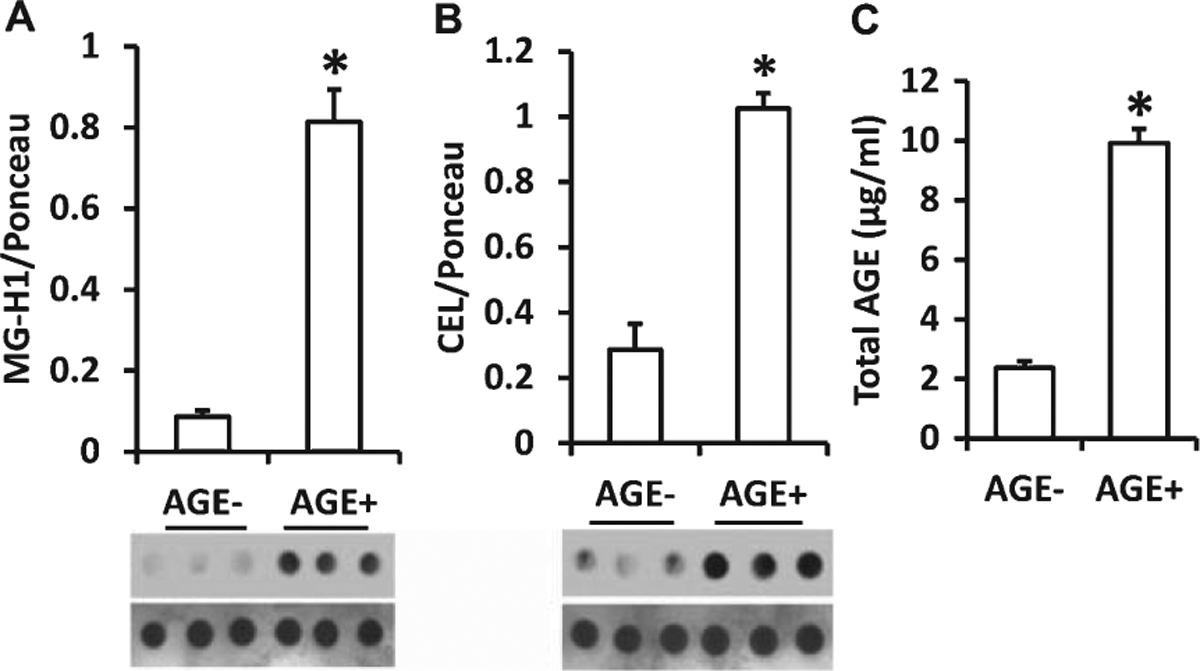
Fig. 3.

Measurement of levels of AGEs in serum from AGE diet fed mice. Quantification of immunodot intensity of MG-H1 (A) and CEL (B) normalized to Ponceau staining intensity in serum of AGE− and AGE+ diet fed mice. Ponceau staining of membranes of corresponding dot blots was used as a protein loading control (A & B, lower panel). ELISA for the measurement of AGE (C) levels in serum samples of AGE− and AGE+ fed mice. Data are presented as mean ± SEM (n = 5), *p < 0.01 versus AGE− fed mice as a control group.
