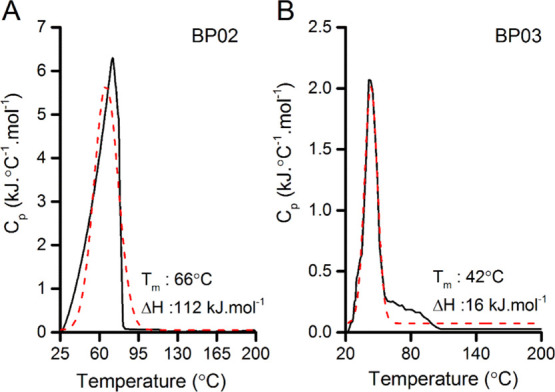
Figure 4.

DSC thermogram of proteins (A) BP02 and (B) BP03. The Tm value of the protein BP02 (66 °C) is greater than that of BP03 (42 °C). The solid black line represents experimental data, while the dashed red line represents the curve fit (the nonlinear curve fit).
