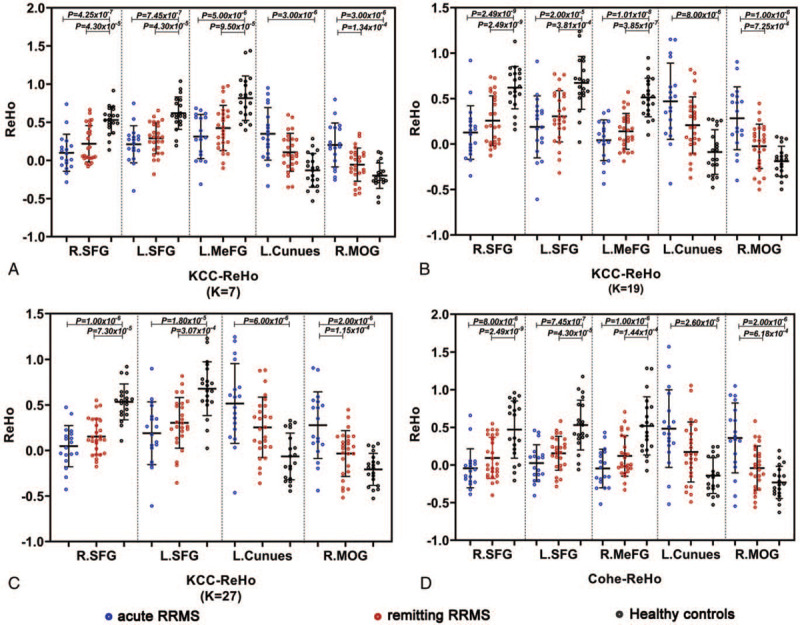
Figure 2.

Scatter diagram of the regional homogeneity index among the acute RRMS, remitting RRMS patients and HC groups in the identified brain regions (P < .001, Bonferroni correction). The blue dots represent the acute RRMS group, the red dots represent the remitting RRMS group, and the black dots represent the HC groups. L = left, MeFG = medial frontal gyrus, MOG = middle occipital gyrus, R = right, SFG = superior frontal gyrus.
