
Figure 3.
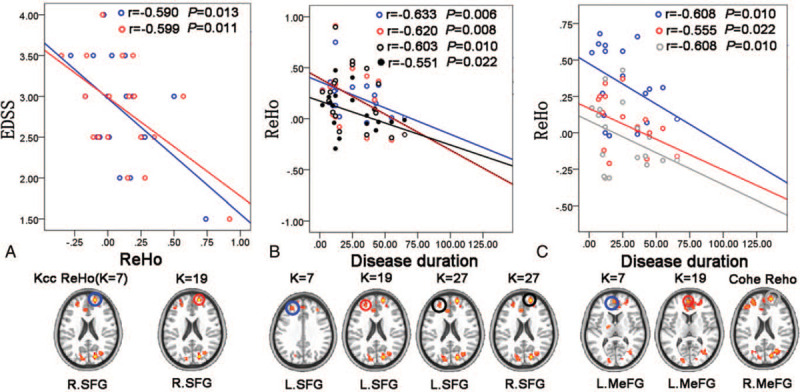
Associations between altered ReHo and clinical variables in the acute RRMS patients (P < .05). Results based on KCC-ReHo analysis (when K=7) are uniformly shown in blue; results based on KCC-ReHo analysis (when K=19) are in red; results based on KCC-ReHo analysis (when K=27) are in black (particularlly, the black solid circle and solid line represent the L.SFG, and the black hollow circle and dotted line represent the R.SFG) and results based on Cohe-ReHo analysis are uniformly shown in gray. EDSS = expanded disability status scale, L = left, MeFG = medial frontal gyrus, R = right, ReHo = regional homogeneity, SFG = superior frontal gyrus.