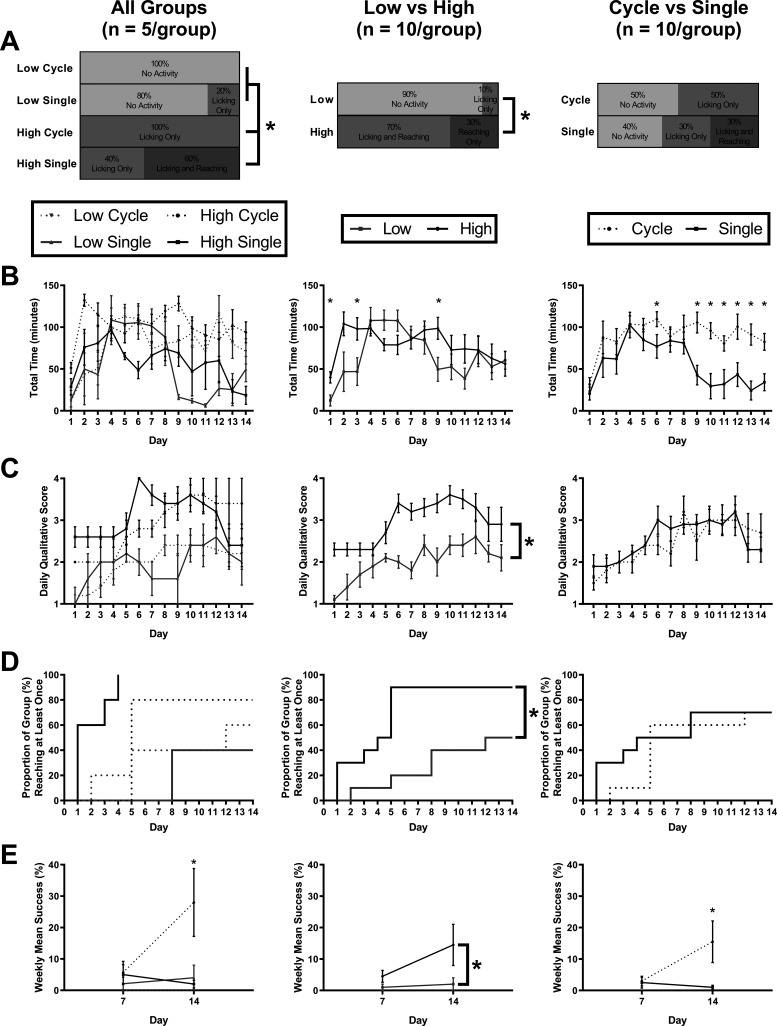
Figure 2.
HASRA parameter optimization. A, Proportion of each group showing varying behaviors on day 1 of exposure to the task. B, Mean time per day (minutes) per mouse in which the pellet arm was delivering pellets for each group. This measure of time was used to avoid counting time in which the mouse rapidly entered and exited the HASRA without waiting to actually be delivered at least one pellet. Time in which the animal remained focused on the task long enough to be delivered a pellet more accurately represents, “task engagement.” C, Mean daily qualitative score for each group based on scoring five videos per animal per day. D, Survival curve of percentage of mice that displayed a qualitative score of at least 3 (reaching or licking) by day of training. E, Percentage of successful reaching events based on scoring of 20 events per mouse at each time point. All data are represented as mean ± SEM; * represents a post hoc statistical effect of p < 0.05.

