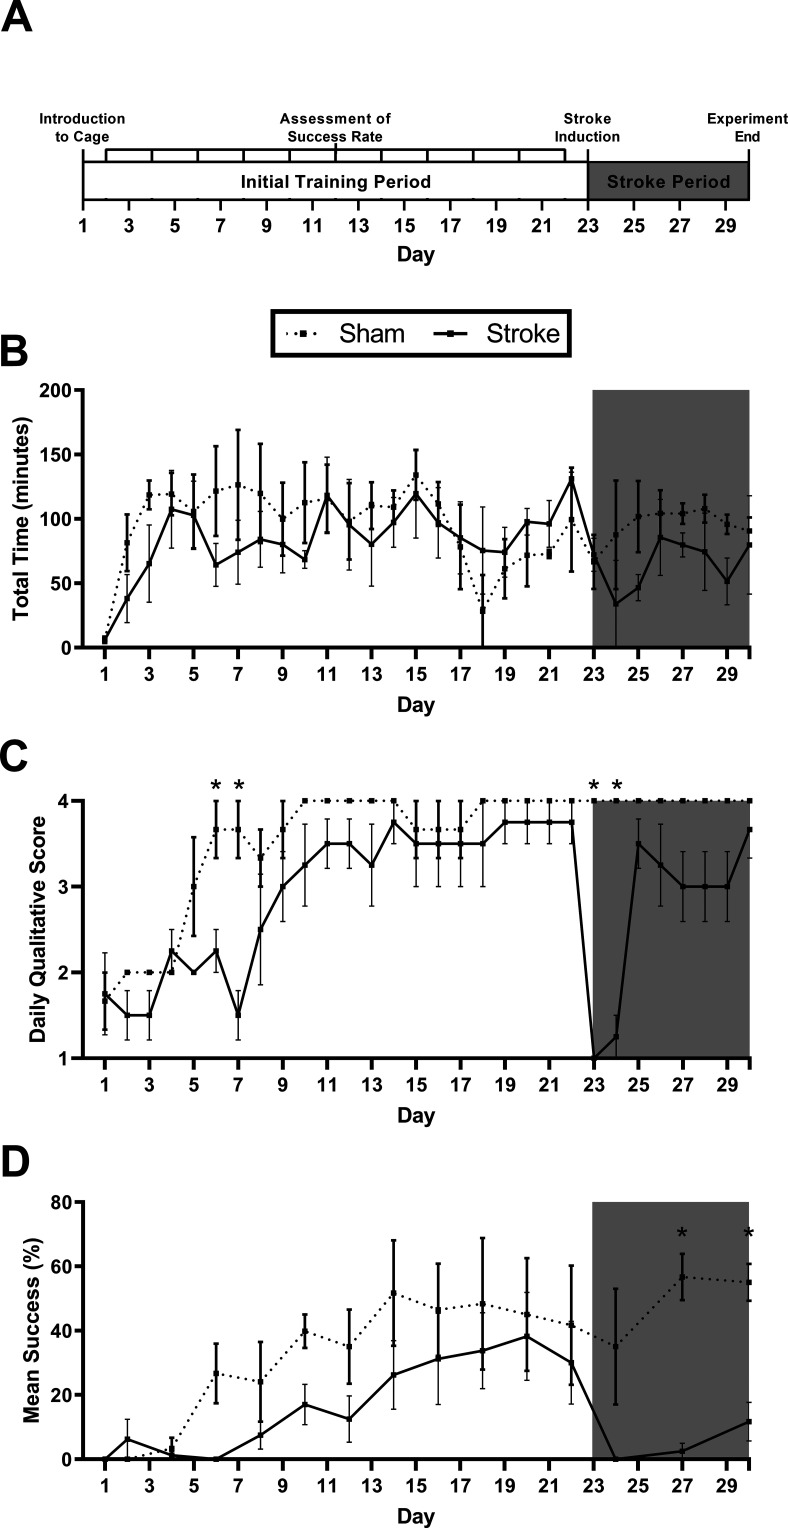
Figure 4.
HASRA sensitivity to lesion-induced impairments. A, Timeline of experiment 2. B, Mean time per day (minutes) per mouse with the pellet arm activated for each group. C, Mean daily qualitative score for each group based on scoring five videos per animal per day. D, Percentage of successful reaching events based on scoring of 20 events per mouse at each time point. The white portion of each graph represents time points before stroke, whereas data in the gray portion of the graph represent poststroke time points. All data are represented as mean ± SEM. N = 7 for all panels; * represents a post hoc statistical effect of p < 0.05.

