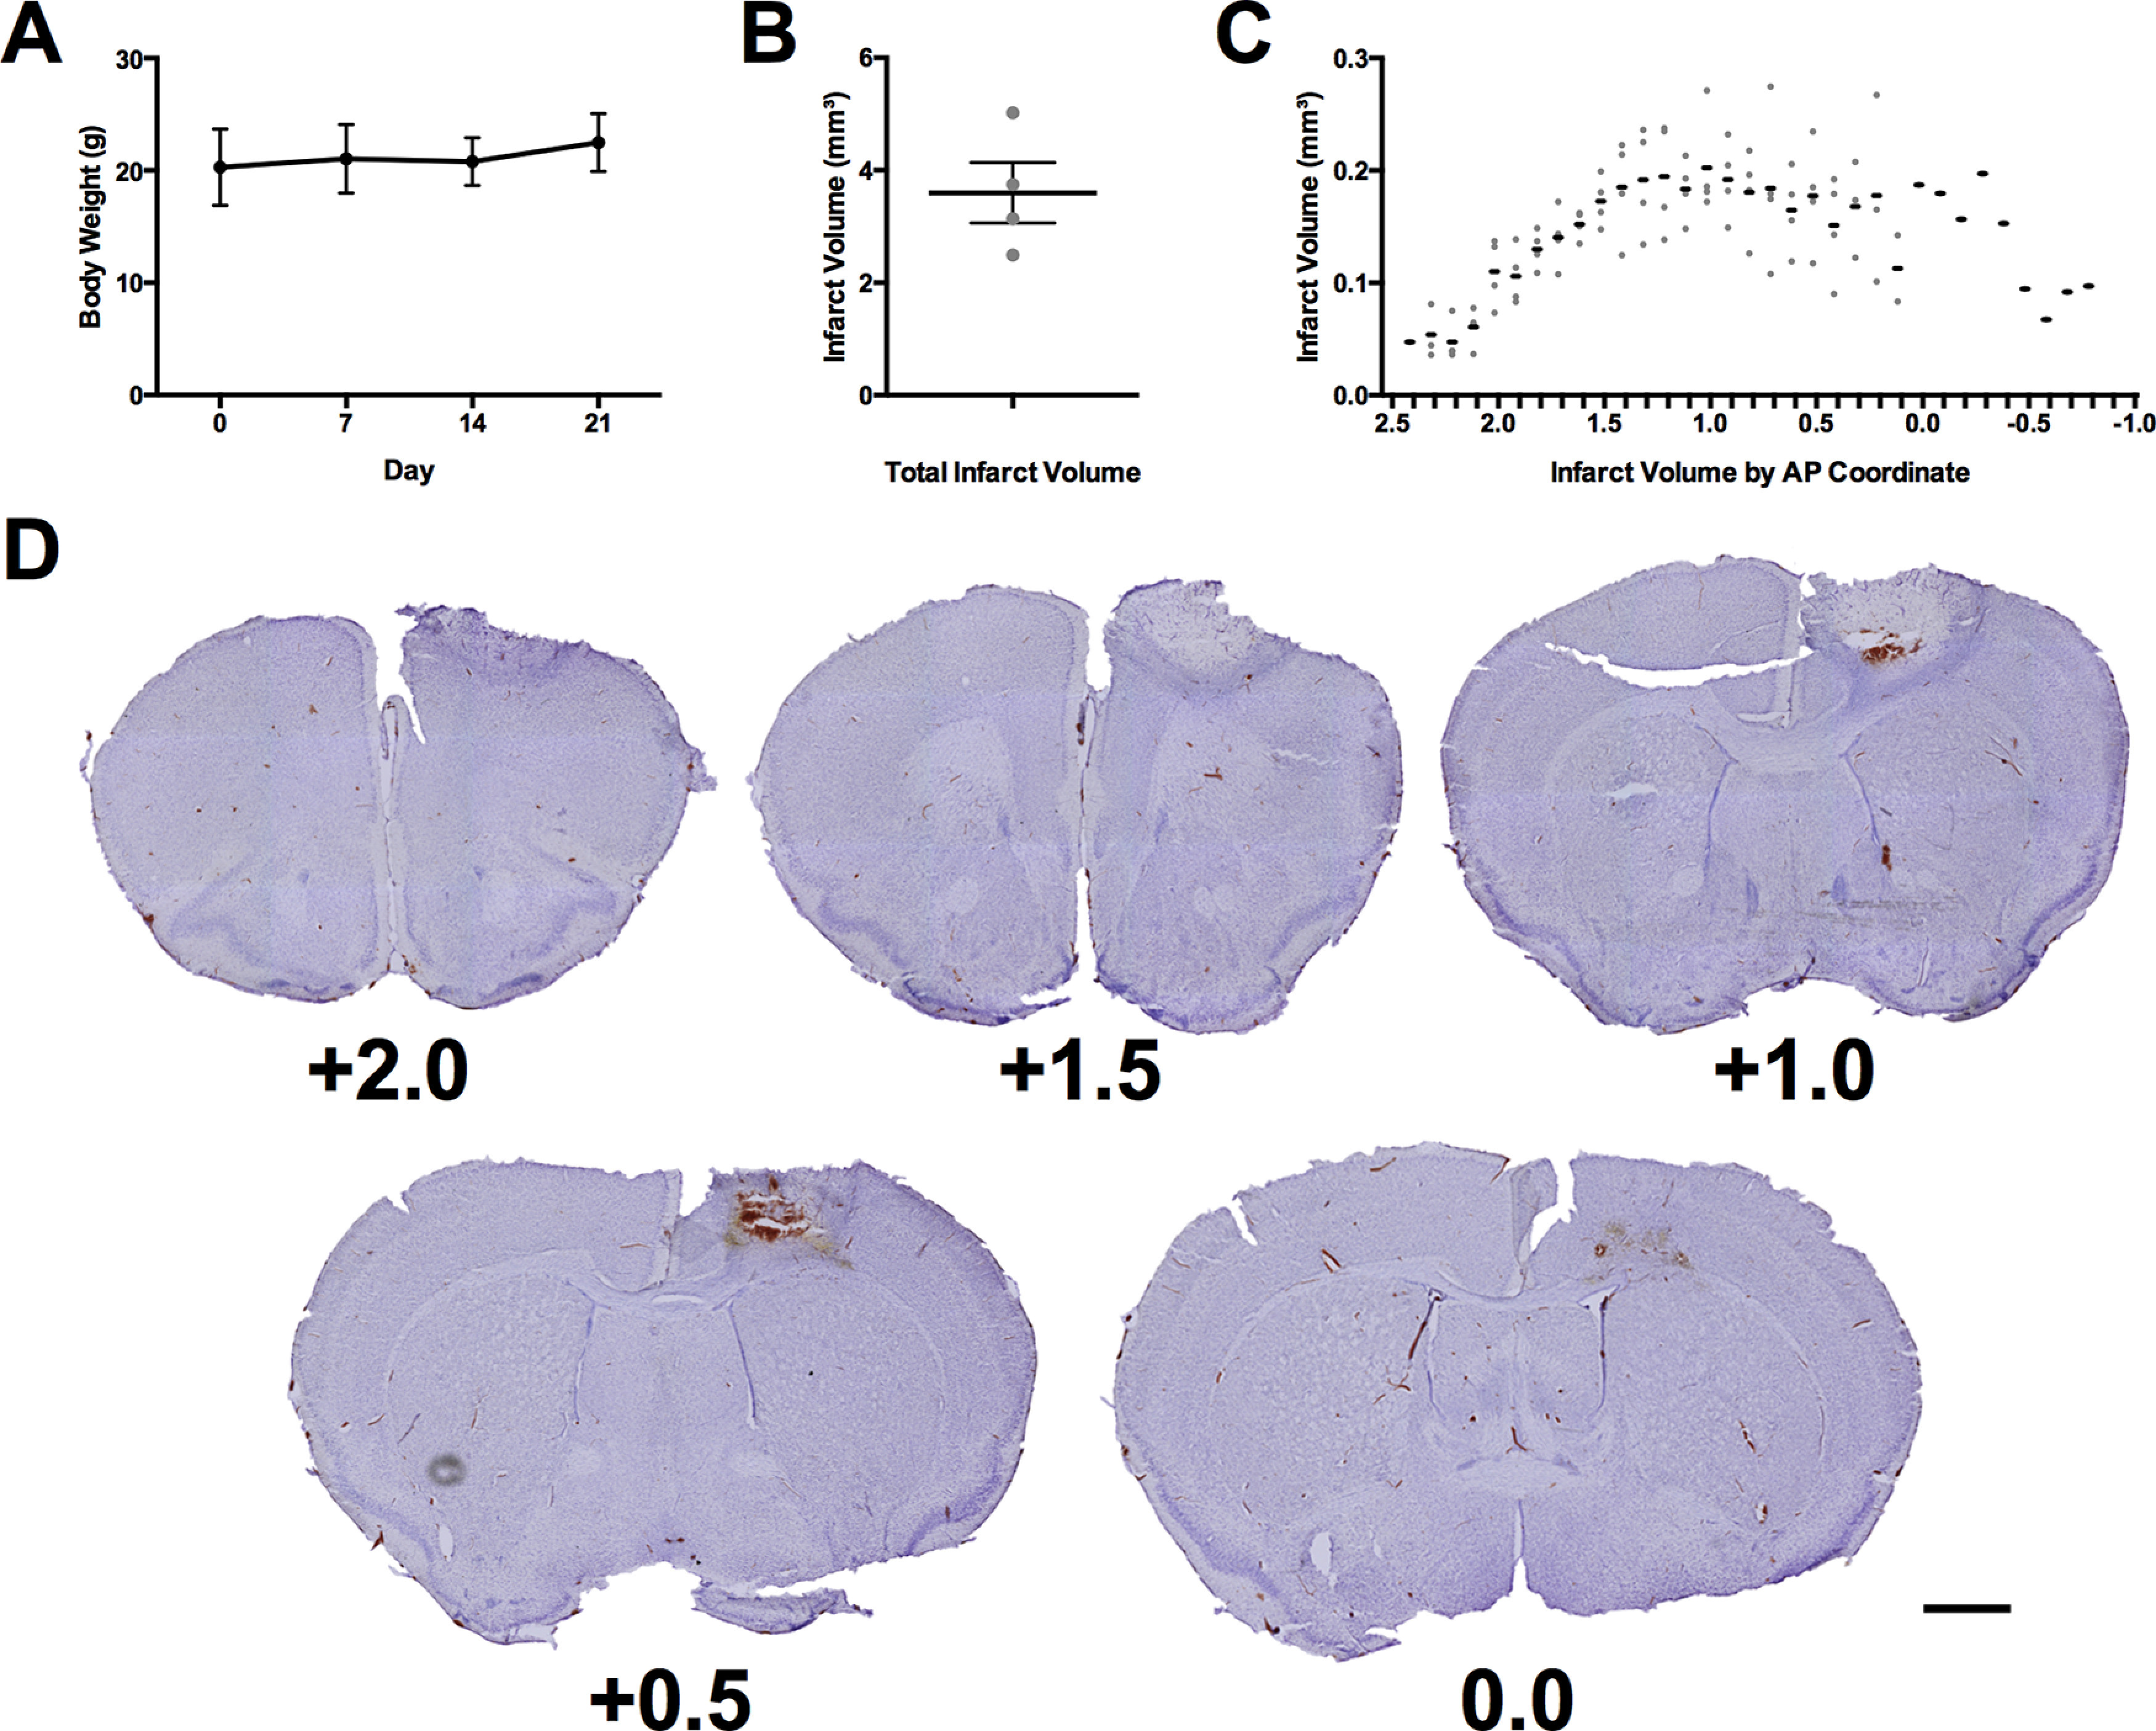
Figure 5.

Verification of animal health and lesion induction. A, Mean body weight of all mice throughout experiment 2. B, Mean total infarct volume of all mice receiving stroke. C, Infarct volume of all mice receiving stroke at each anteroposterior coordinate of damage relative to bregma. D, Representative cresyl violet images of lesion in the mouse with the total infarct volume closest to the mean (3.75 mm3). Each image is labeled with its distance anterior to bregma in millimeters. Scale bar = 1 mm. The black lines in panels A–C represent the group mean ± SEM. The gray dots in panels B, C represent the infarct volumes of individual animals. N = 7 for panel A and n = 4 in panels B, C.
