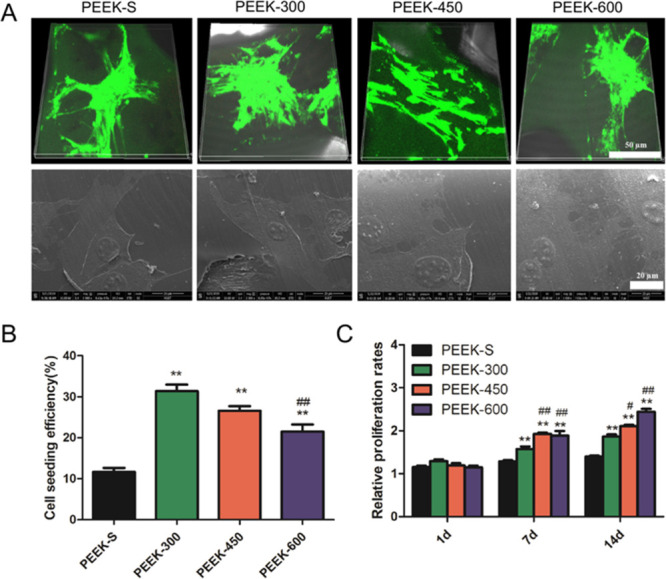
Figure 4.

SEM image and fluorescence staining of the morphology of cells on the PEEK scaffold surface. Cell adhesion and proliferation within the PEEK scaffold measurement. (A) Live/Dead staining and SEM images of cells attached to the different PEEK scaffolds after three days of culture (live cells: green and dead cells: red). (B) Cell-seeding efficiency on the different PEEK scaffolds. (C) Relative proliferation rates of cells incubated with different PEEK scaffolds for 1, 7, and 14 days as examined by CCK-8. *P < 0.05 and **P < 0.01 compared with PEEK-S; #P < 0.05 and ##P < 0.01 compared with PEEK-300. The upper images share 50 μm scale bar and the lower images share 20 μm scale bar (A). For each group, n = 3.
