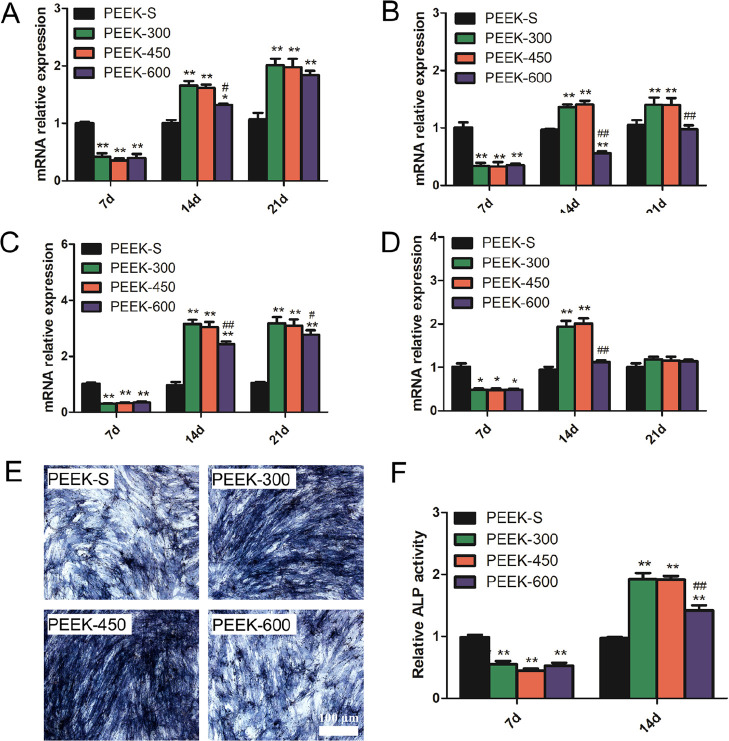
Figure 5.
Osteogenic differentiation as evaluated by osteogenesis-related gene expression and ALP activity. (A–D) Relative expression levels of ALP, RUNX2, COL1, and BMP2 at day 7, 14, and 21. (E) ALP staining results of the cells after culturing with different PEEK scaffolds for 14 days. (F) Relative ALP activity of cells on the different PEEK scaffolds at days 7 and 14. *P < 0.05 and **P < 0.01 compared with PEEK-S; #P < 0.05 and ##P < 0.01 compared with PEEK-300. The images share 100 μm scale bar (E). For each group, n = 3.

