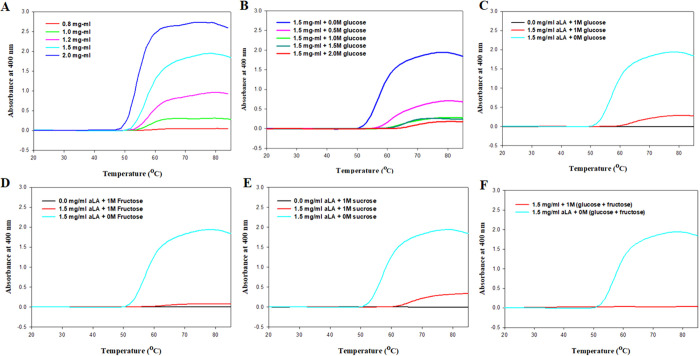
Figure 1.
(A) Temperature-dependent aggregation profile of α-LA in the range 0.8–2.0 mg mL–1. (B) Thermal aggregation of α-LA in the presence of increasing concentration of glucose at pH 4.5. (C) Thermal aggregation of α-LA (1.5 mg mL–1) in the presence of glucose at pH 4.5. (D) Thermal aggregation of α-LA (1.5 mg mL–1) in the presence of fructose at pH 4.5. (E) Thermal aggregation of α-LA (1.5 mg mL–1) in the presence of sucrose at pH 4.5. (F) Thermal aggregation of α-LA (1.5 mg mL–1) in the presence of glucose + fructose at pH 4.5.

