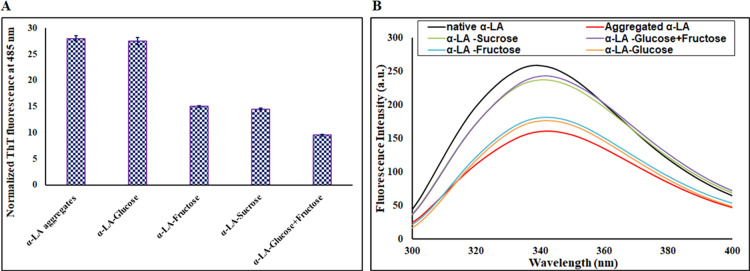
Figure 2.
(A) ThT fluorescence intensity of aggregated α-LA in the absence and presence of 1 M sugar osmolytes. Error bars represent the standard errors of the mean estimated from at least three individual measurements. (B) Trp fluorescence intensity of native α-LA and aggregated α-LA in the absence and presence of 1 M sugar osmolytes.

