
Fig. 2.
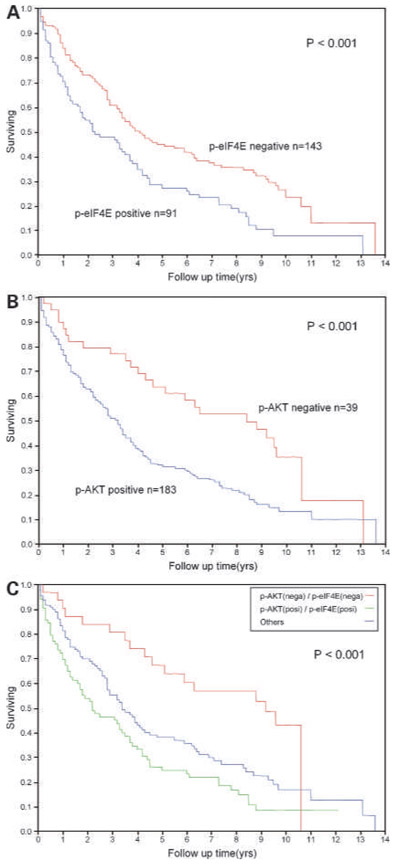
Kaplan-Meier curve comparing overall survival for AKT, p-eIF4E, and various combinations of AKT and p-eIF4E: worse survival for p-eIF4E–positive patients (blue line) compared with p-eIF4E–negative patients (red line; A), worse survival for p-AKT–positive patients (blue line) compared with p-AKT–negative patients (red line; B), and worse survival for patients with a combination of p-AKT and p-eIF4E–positive tumors (green line; n = 83) compared with those with a combination of p-AKT– and p-eIF4E–negative tumors (red line; n = 31) and the other patients (blue line; n = 108; C).