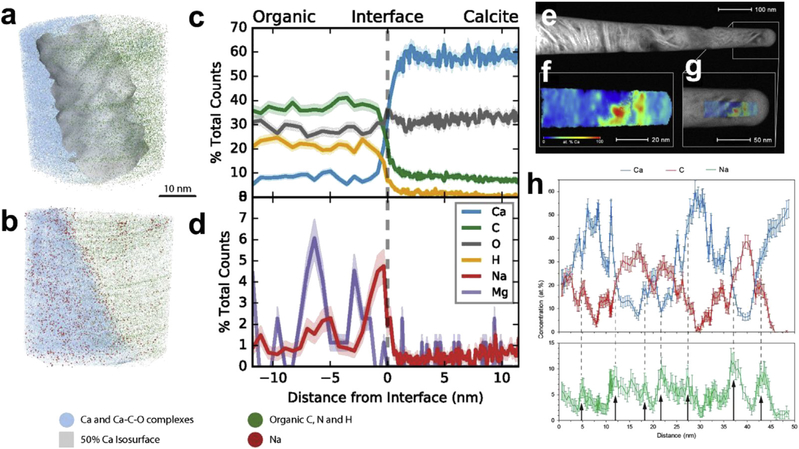
Fig. 1.
Atomic map of mineral-organic interfaces in (a—d) marine foraminiferal calcite showing the compositional portioning in segregation of Na to the interface [36] and (e—h) correlative microscopy of human bone [34]. (e) STEM image of the APT needle, (f) 2D map of the distribution of Ca in the specimen, (g) the overlay of STEM image and APT reconstruction, and (h) compositional profile showing the heterogenous distribution of minerals, organic components, and associated Na segregation. STEM, Scanning transmission electron microscopy.

