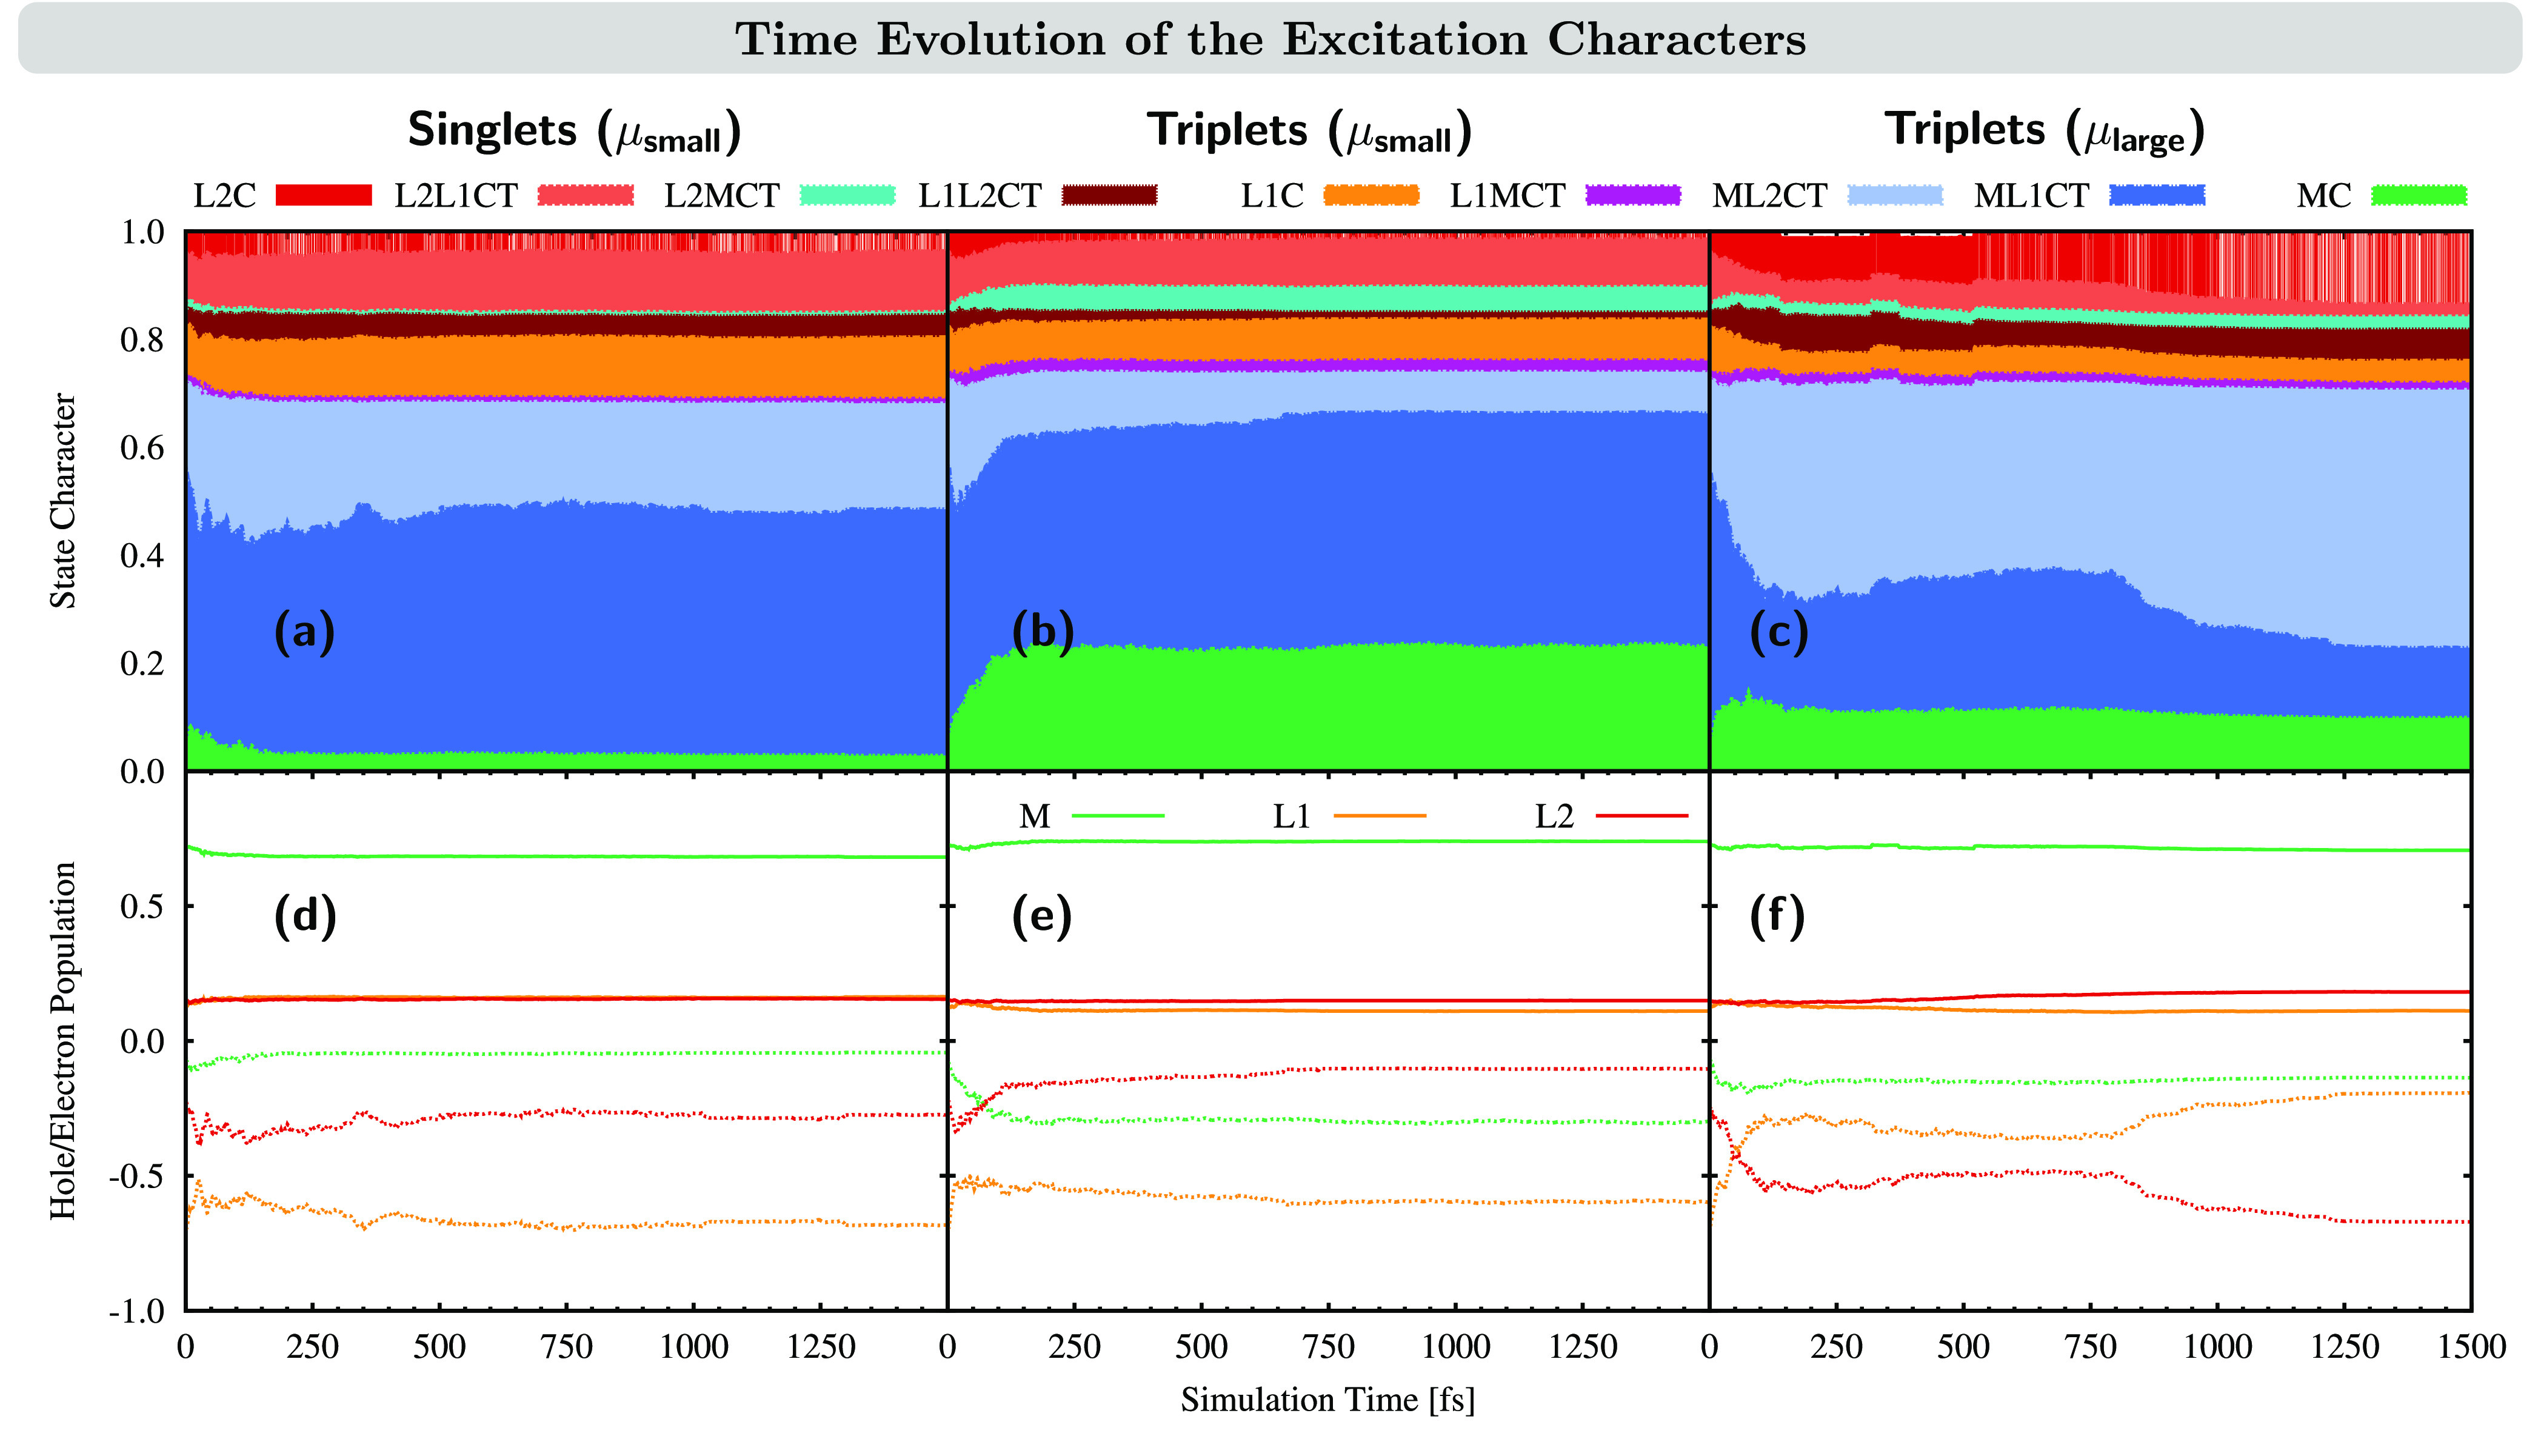
Figure 7.

Time evolution of the excited-state character. (a–c) Analysis in terms of the excitation character as defined in Figure 3. (d–f) Hole (positive axis, solid line) and electron (negative axis, dotted line) populations on the three fragments during the dynamics. Left panel (a and d): Analysis for trajectories remaining in the singlet manifold. Middle panel (b and e): Analysis for trajectories ending up in the triplet manifold with small dipole moments μ < 0.5 D. Right panel (c and f): Analysis for trajectories ending up in the triplet manifold with large dipole moments μ > 0.5 D.
