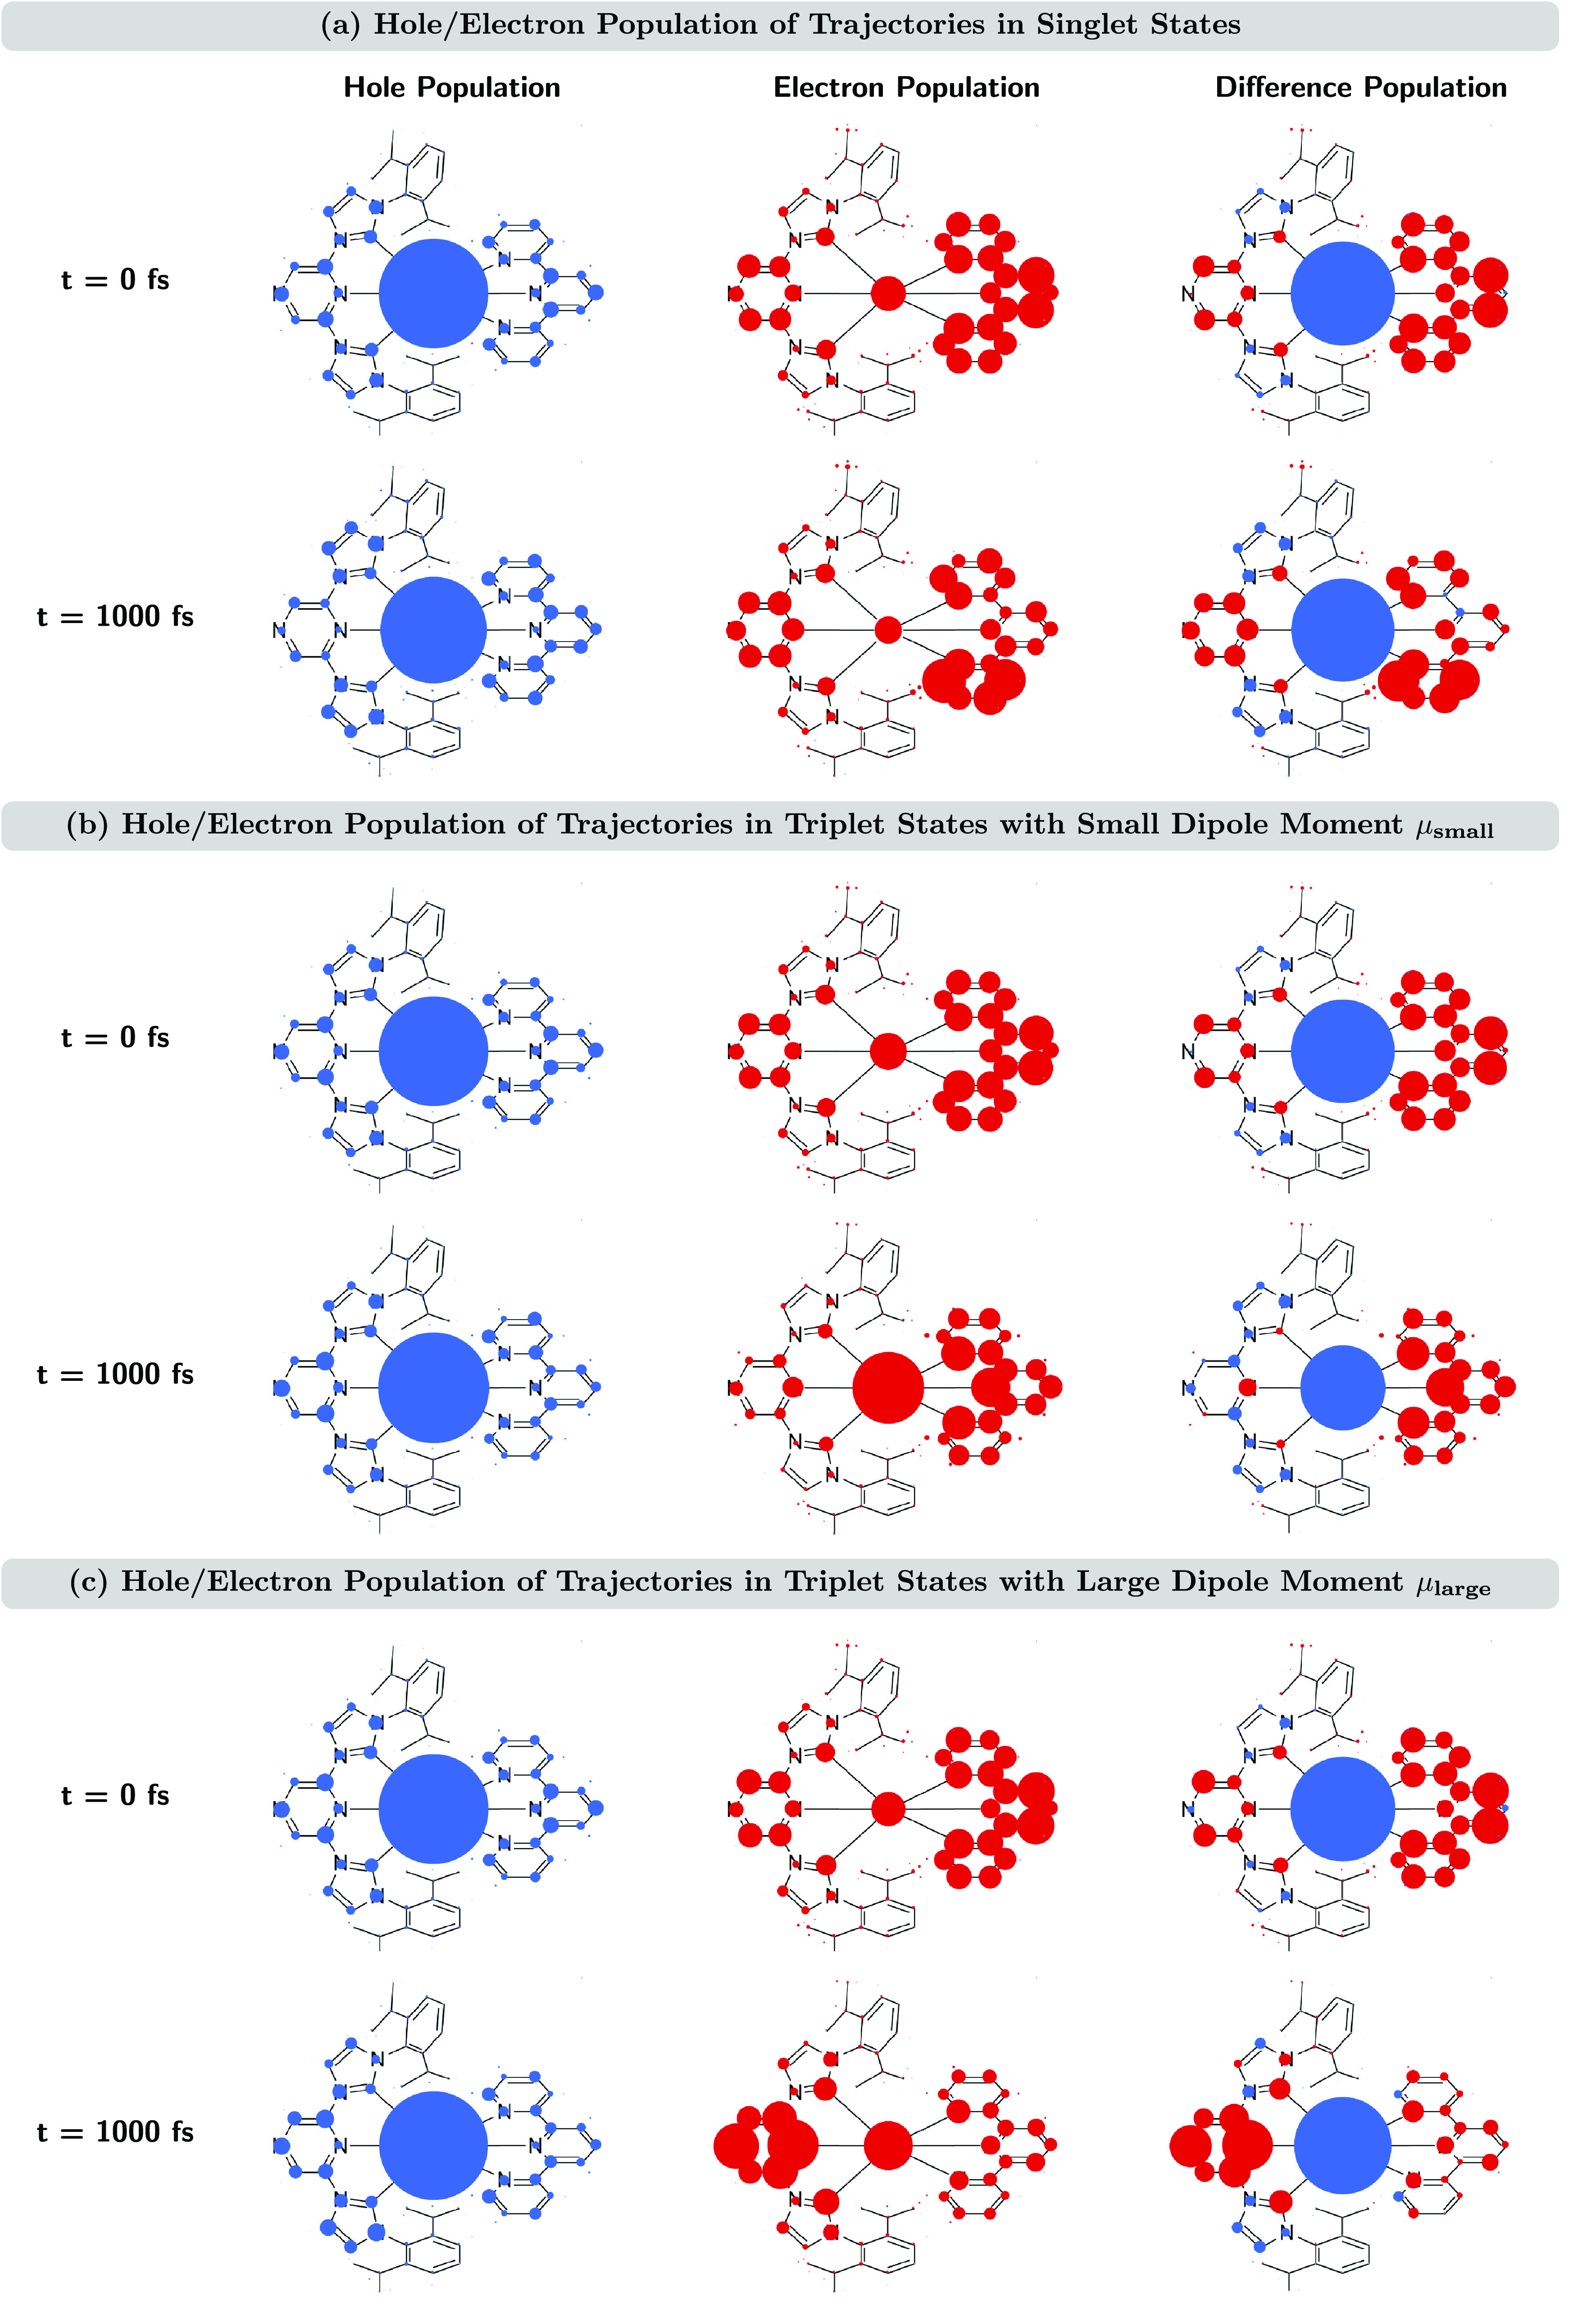
Figure 8.

Atomic hole populations (left column), electron populations (middle column), and hole/electron difference populations (right column) for trajectories in singlet states (a), trajectories in triplet states with small static dipole moments μsmall (b), and trajectories in triplet states with large static dipole moments μlarge (c) at different simulation times t = 0 and 1000 fs. The areas of the circles correspond to the sizes of the populations. Positive (negative) hole/electron difference populations are shown as blue (red) circles.
