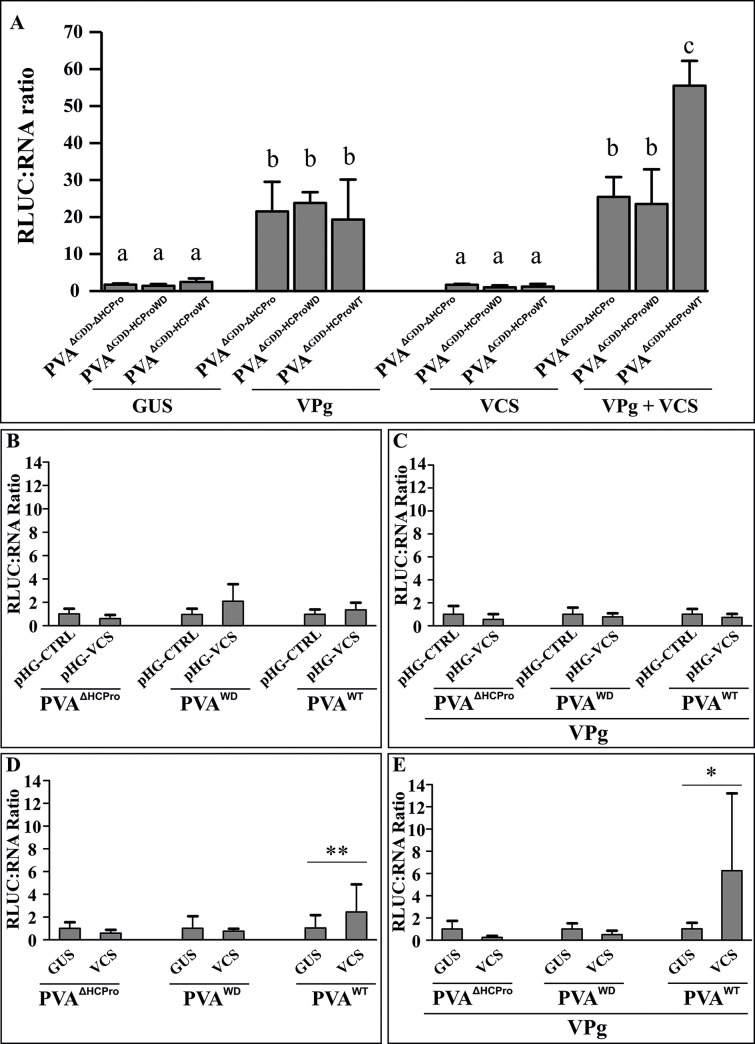
Fig 7. Both VPg and VCS-HCPro interaction promote PVA translation.
(A) RLUC/vRNA ratio of non-replicating variants of PVA RNA (PVAΔGDD-ΔHCPro, PVAΔGDD-HCProWD and PVAΔGDD-HCProWT) was quantitated during VPg, VCS and VPg + VCS overexpression. All virus constructs were infiltrated at OD600 = 0.05 and all overexpression constructs at OD600 = 0.25. VCS overexpression was initiated with a mix of Agrobacterium carrying VCS-A, VCS-B and VCS-C constructs each at OD600 = 0.25. Samples for the dual luciferase assay and RNA quantification via qPCR were collected at 3 dpi. Statistical significance was assessed using student’s t-test (*P < 0.05). Different letters above the bars indicate a statistically significant difference. (B—D) Fold change in the RLUC/vRNA ratio in replicating variants of PVA- (PVAΔHCPro, PVAWD and PVAWT) upon VCS-silencing (B, C) and overexpression (D, E). The ratios were determined both without (B, D) and with (C, E) overexpressed VPg. All PVA constructs were infiltrated at OD600 = 0.01. The silencing constructs were infiltrated one day before virus infiltration at OD600 = 0.4, whereas the overexpression constructs were co-infiltrated with PVA constructs. VPg was infiltrated at OD600 = 0.4. The VCS overexpression set contained a mix of VCS-A, VCS-B and VCS-C each infiltrated at OD600 = 0.1. All samples were collected at 4 dpi. The concentration of infiltrated Agrobacterium between different samples in (A-E) was equalized with Agrobacterium carrying either pHG-CTRL or GUS. The number of plants per experiment was 4 in (A), 6 in (B, C) and 5 in (D, E). Statistical significance between the sets is denoted by asterisk (student’s t-test *P < 0.05, **P < 0.01).

