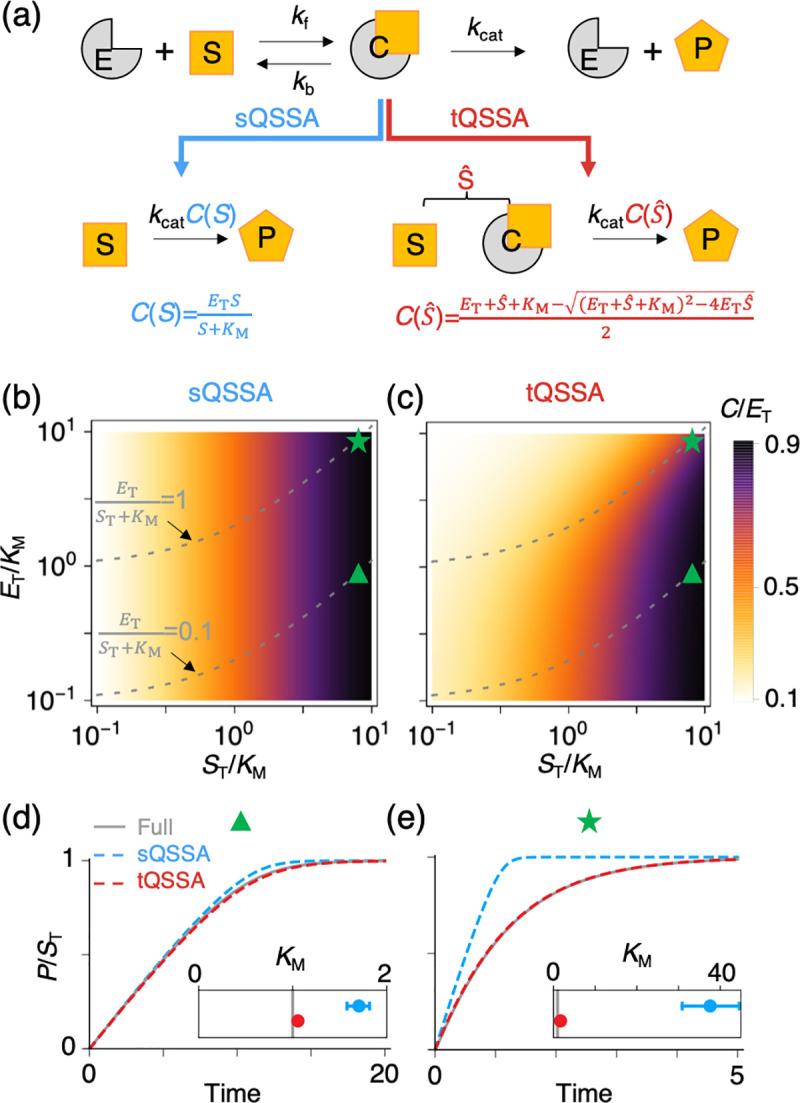
Fig 1. Comparison of the sQSSA and tQSSA for an enzyme-catalyzed reaction.

(a) The MM mechanism for a single-substrate enzyme-catalyzed reaction; S, substrate; E, enzyme; C, enzyme-substrate complex; P, product. Note that we use a different font style to distinguish a substance, S, from its concentration, S in Eq 1. The full model, based on mass-action kinetics (Eq 1), can be simplified by either the sQSSA (Eq 3) or the tQSSA (Eq 5). Both approximations assume that C rapidly reaches a QSSA, which is solely determined by either S (Eq 2) or (Eq 4). (b–c) Heat maps of the predicted maximal fraction of total enzyme that is in complex with substrate, i.e., C(ST)/ET, predicted with sQSSA (Eq 2) and tQSSA (Eq 4). In these panels, color represents the ratio C(ST)/ET, and gray dashed lines are contours of ET /(KM + ST) = 0.1 and 1.0. The sQSSA (Eq 2) predicts that this fraction is independent of total enzyme concentration, ET (e.g., C(ST)/ET = 0.5 when ST = KM regardless of ET) in panel b. On the other hand, the tQSSA (Eq 4) predicts that, as ET increases, more substrate is needed to achieve that same level of substrate saturation of enzyme molecules in panel c. When the validity condition for the sQSSA holds (i.e., below the gray dashed line where ET /(KM + ST) ≪1), the predictions of the two models are nearly identical. (d–e) The simulated accumulation of P and the estimation of the Michaelis constant, KM, from the progress curve of P. For these calculations, we chose kf = 10, kb = 9, kcat = 1, KM = 1, ST = 9, and ET /(KM + ST) = 0.1 (panel d; triangle mark in (b) and (c)) or 1 (panel e; star mark in (b) and (c)). Initial conditions are S(0) = ST, C(0) = 0, P(0) = 0. If ET is low (i.e., ET /(KM + ST) = 0.1), the simulation of P and the estimation of KM with the sQSSA model are accurate (d). On the other hand, if ET is high (i.e., ET /(KM + ST) = 1), the simulated P with the sQSSA model using the true rate constants is wildly divergent from the true progress curve simulated with the full model (e). As a result, if kcat and KM are adjusted to fit the sQSSA model to the true progress curve, then the estimates of kcat and KM are far from the true values (inset; the estimates of kcat is not shown). On the other hand, the tQSSA model accurately reproduces the progress curve of P and estimates the rate constants regardless of the value of ET (d and e). Inset: gray lines are the true value of KM, and the red and blue circles are the mean KM estimates from the tQSSA and sQSSA models, respectively. The bars represent 99% confidence intervals. The Quasi-Newton method is applied to 21 sampled points of the progress curve of P simulated with the full model to identify the value of KM that minimizes the fitting error of the sQSSA and tQSSA models. The true values of parameters are used as the initial condition for the fitting procedure in order to avoid parameter unidentifiability. MM, Michaelis–Menten; sQSSA, standard quasi-steady state approximation; tQSSA, total quasi-steady state approximation.
