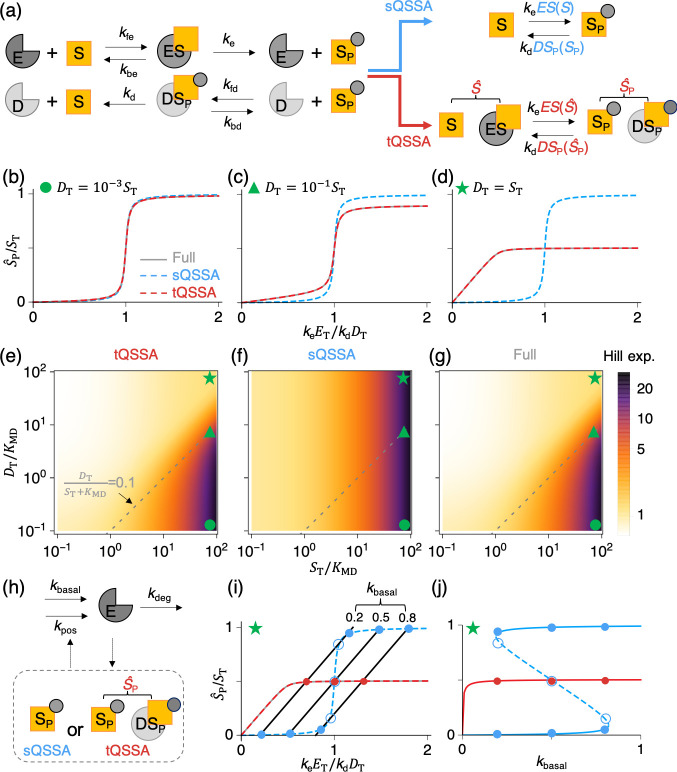
Fig 2. sQSSA, but not tQSSA, makes false predictions of zero-order ultrasensitivity and bistability.
(a) In the GK mechanism, substrate (S) is phosphorylated by kinase (E), and then phosphorylated substrate (SP) is dephosphorylated by phosphatase (D). The full model based on mass-action kinetics (Eq 6) can be simplified by replacing the concentrations of the substrate–kinase complex (ES) and phosphorylated substrate–phosphatase complex (DSP) with either the sQSSA (Eq 7) or the tQSSA (Eq 8). In the tQSSA model, and are total unphosphorylated substrate and phosphorylated substrate concentration, respectively. (b–d) As the total concentration of kinase (ET) increases, the steady-state concentration of phosphorylated substrate () increases. The sQSSA model predicts a steep sigmoidal response of regardless of the level of DT (in this case, , as complexes are assumed to be negligible). On the other hand, both the full and the tQSSA models predict that the steep response is lost as DT increases. In these calculations, ST = 100, kfe = kfd = 10, kd = ke = 1.7, and KME = KMD = 1. (e–g) Heat maps of the predicted effective Hill exponent of the response function. When the validity of the sQSSA is not satisfied (i.e., above the dashed gray line), the tQSSA model (e) but not the sQSSA model (f) captures the results of the full model (g). Here, the effective Hill exponent is estimated using log[81]/log[EC90/EC10] [42]. The circle, triangle, and star mark represent the parameter values used for (b), (c), and (d), respectively. (h) Synthesis and degradation of the kinase (E) are added to the sQSSA and tQSSA models for the GK mechanism (a). In particular, the addition of -dependent synthesis of E (kpos) creates a positive feedback loop between and E. (i–j) In panel i, the steady states of the extended positive feedback models (circles) are intersections of the nullclines of ET defined by (solid black lines) and of the original models of the GK mechanism defined by (colored lines; for the sQSSA model as complexes are assumed to be negligible). As the nullcline of ET changes, depending on the basal synthesis rate of E (kbasal), so do the steady states in panel i, which is also illustrated as a bifurcation diagram in panel j. The filled and open circles represent stable and unstable steady states, respectively. In the bifurcation diagram, the solid and dashed lines denote the stable and unstable steady states, respectively. Here, the same parameter set is used as in (d), with kpos = kdeg = = 0.01. GK, Goldbeter–Koshland; sQSSA, standard quasi-steady state approximation; tQSSA, total quasi-steady state approximation.

