


Fig. 10.
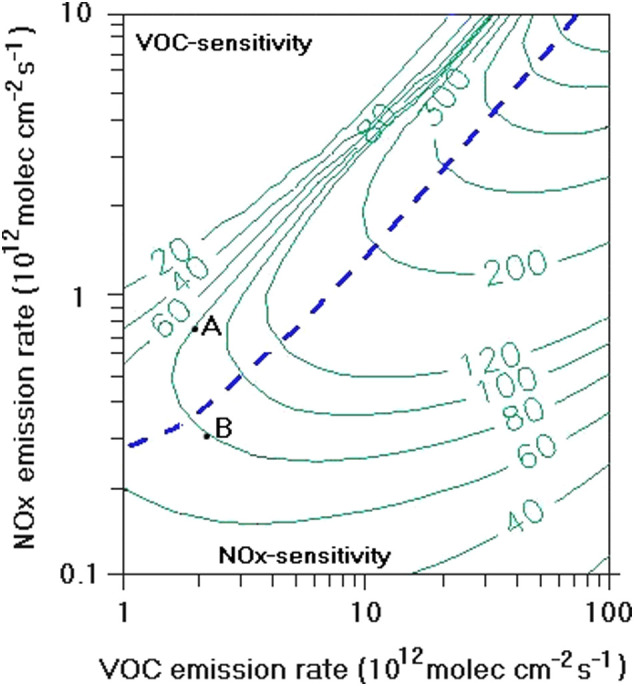
Schematic representation of the resulting maximum ozone isopleths (ppb) as a function of the initial average emission rate for NOx and VOC. The isopleths (solid green lines) represent conditions during the afternoon. The short blue dashed line represents the transition from VOC-sensitive to NOx-sensitive conditions. Point A represents an idealized scenario for the typical urban environment in the MCMA. Point B may represent the new (VOC, NOx) environmental conditions due to emission reductions as strong as those associated with the COVID-19 lockdown. Isopleths diagram adapted from Sillman and He (2002). (For interpretation of the references to color in this figure legend, the reader is referred to the web version of this article.)