
Figure 1. Mn Biokinetic Model.
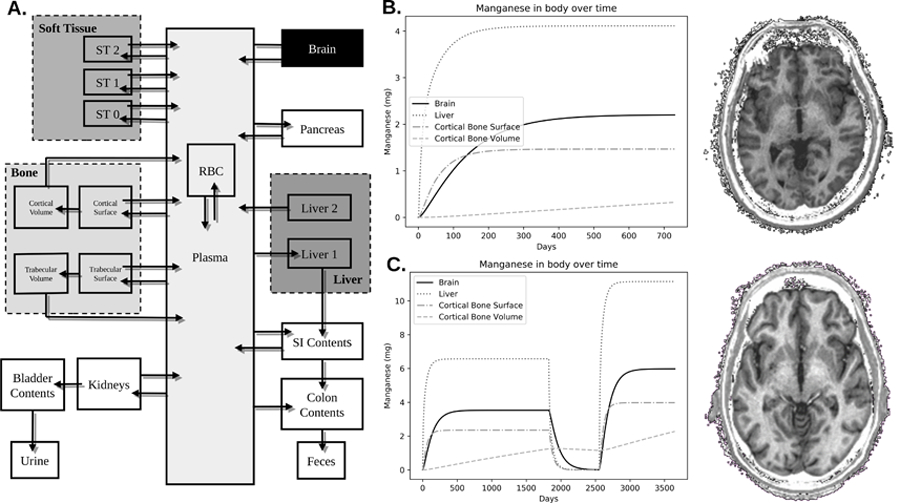
A) This model is derived from a previously published model. Respirable Mn was assumed to be transported into the plasma compartment with 100% efficiency. The model then describes through a series of compartments how Mn disperses itself throughout the body. This study used values of excess brain Mn that was calculated from the brain compartment. B) Shows the trend of Mn accumulation in 6 regions of the body: brain, cortical bone surface, cortical bone volume, trabecular bone surface, trabecular bone volume, and blood plasma. This welder worked for 2 years with an average air Mn exposure concentration of 0.088 mg/m3. C) Another welder worked in three jobs over 10 years. The first job was for 5 years with an air concentration of 0.14 mg/m3. The second job was welding aluminum, and thus no Mn exposure. The third job lasted for 3 years prior to his participation in our study with an exposure level of 0.24 mg/m3. As can be seen by the R1 images on the right, taken from the same location and with the same contrast, the subject in C has much brighter white matter – indicative of higher R1 due to Mn accumulation.