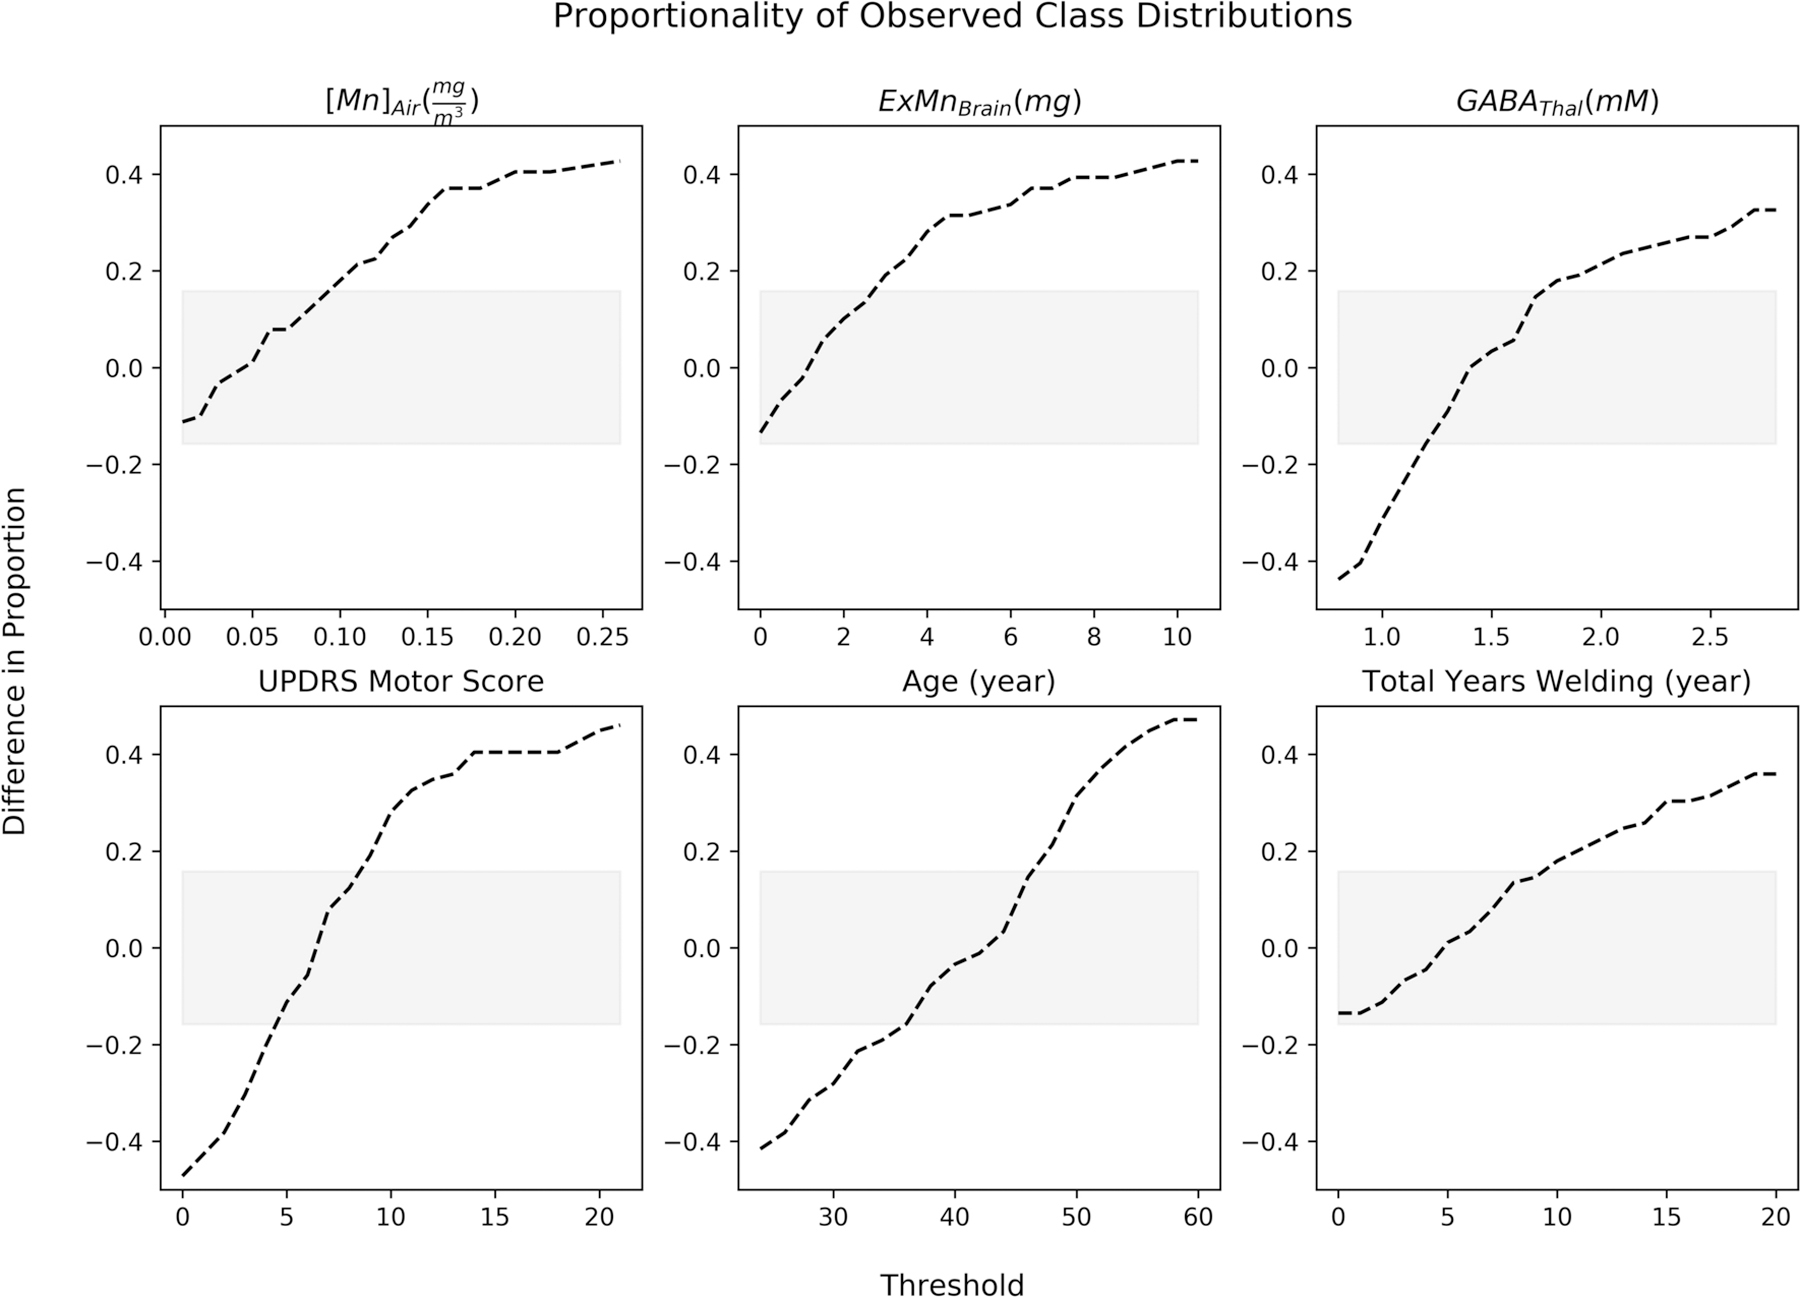
Figure 3. Proportionality of Observed Class Distributions.

The dotted-line represents the difference in proportions between both classes being used in a model at a specific threshold. When the proportion is negative, there are more subjects in the class representing greater than the threshold while when the proportion is positive, there are more subjects in the class representing less than or equal to the threshold. The grey region represents the 95% confidence interval for classes that are equally split. In general, the thresholds move from having greater numbers in the class representing greater than the threshold to having greater numbers in the class less than or equal to the threshold.
