
Figure 4. Proportionality of Combined Prediction Errors.
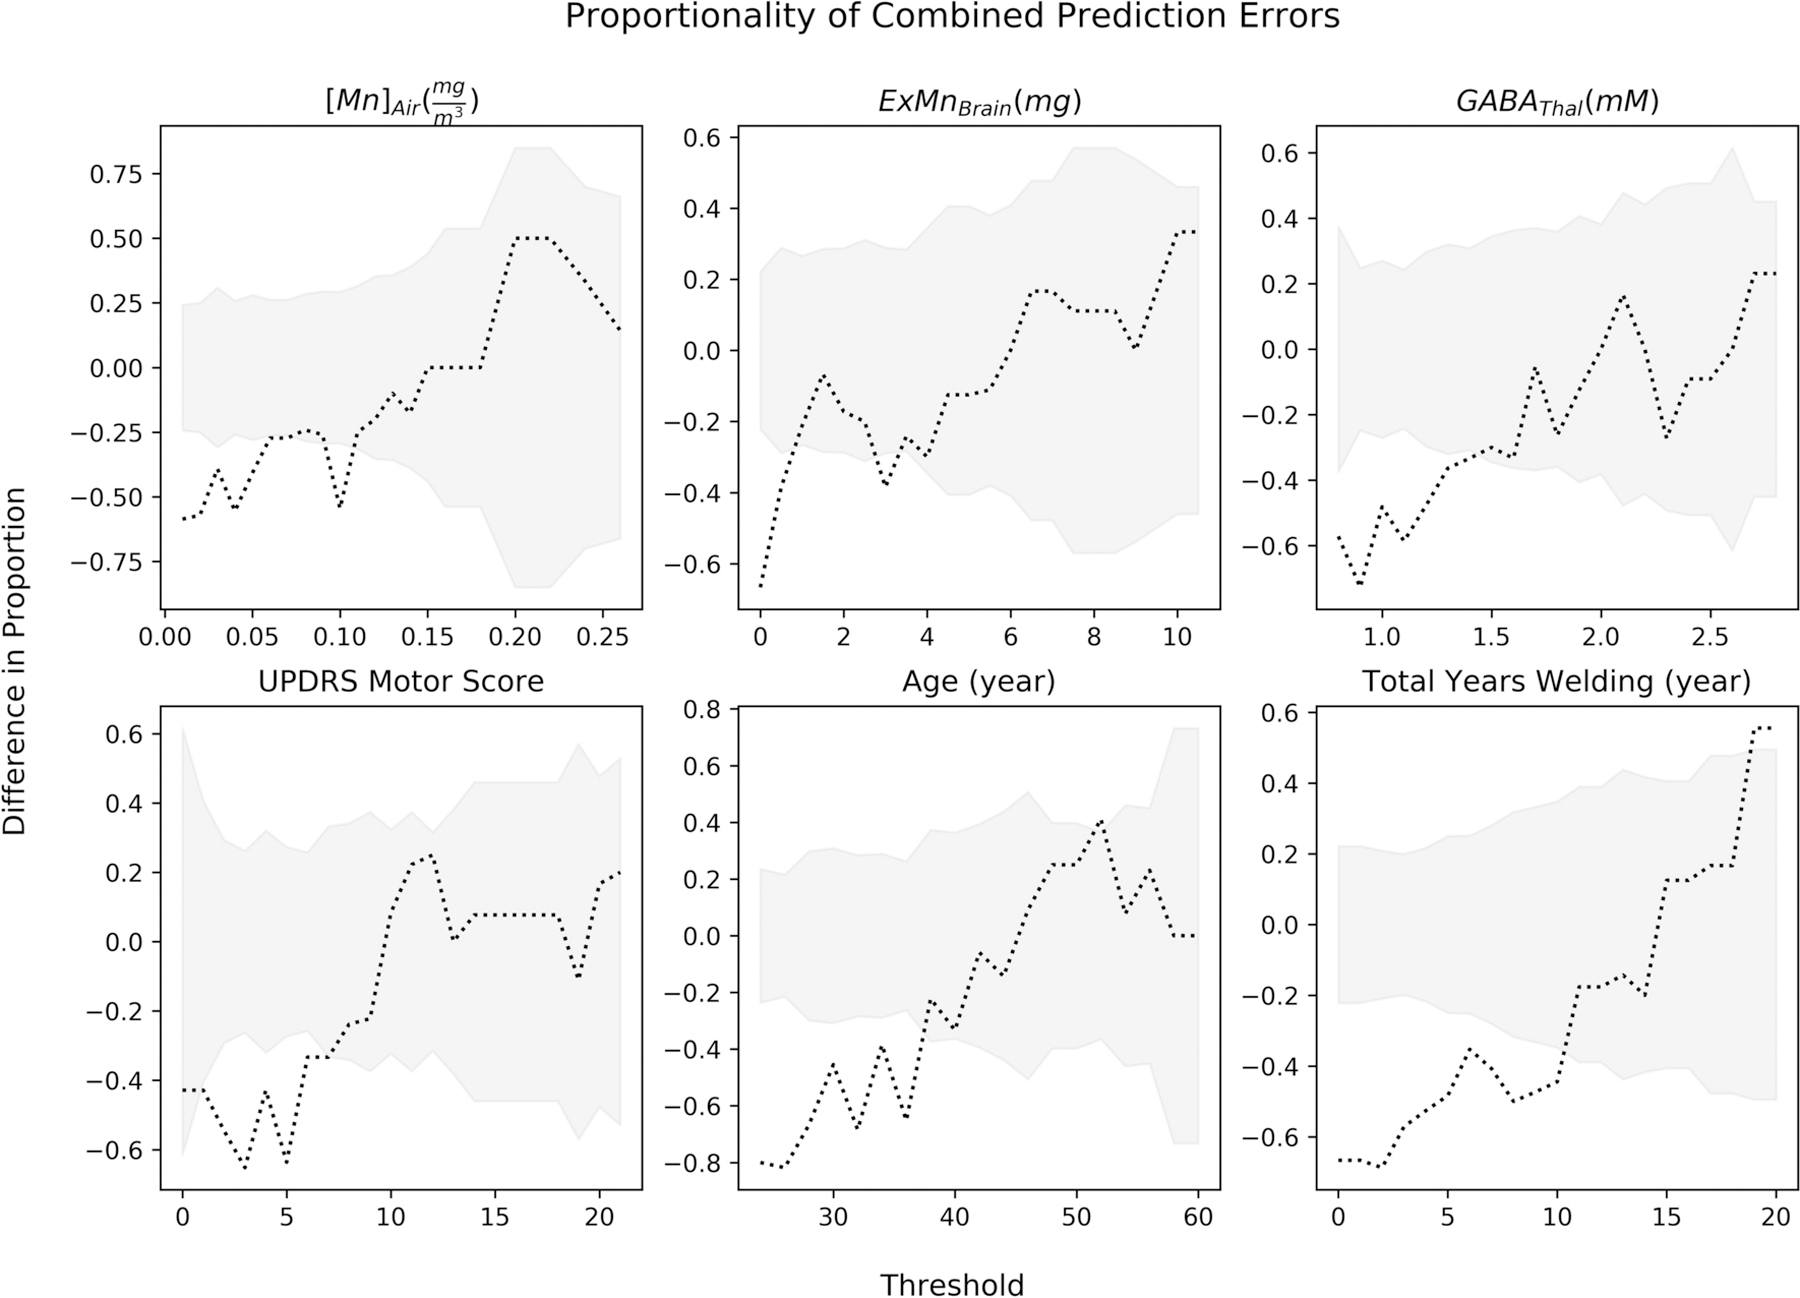
Wald confident intervals were calculated for each threshold and is depicted in grey. The dotted line is the difference in proportion of combined model prediction errors. A negative difference in proportion represents the model incorrectly predicting less in the class less than or equal to the threshold, thus more false positive predictions. A positive difference in proportions represents more false negative predictions.