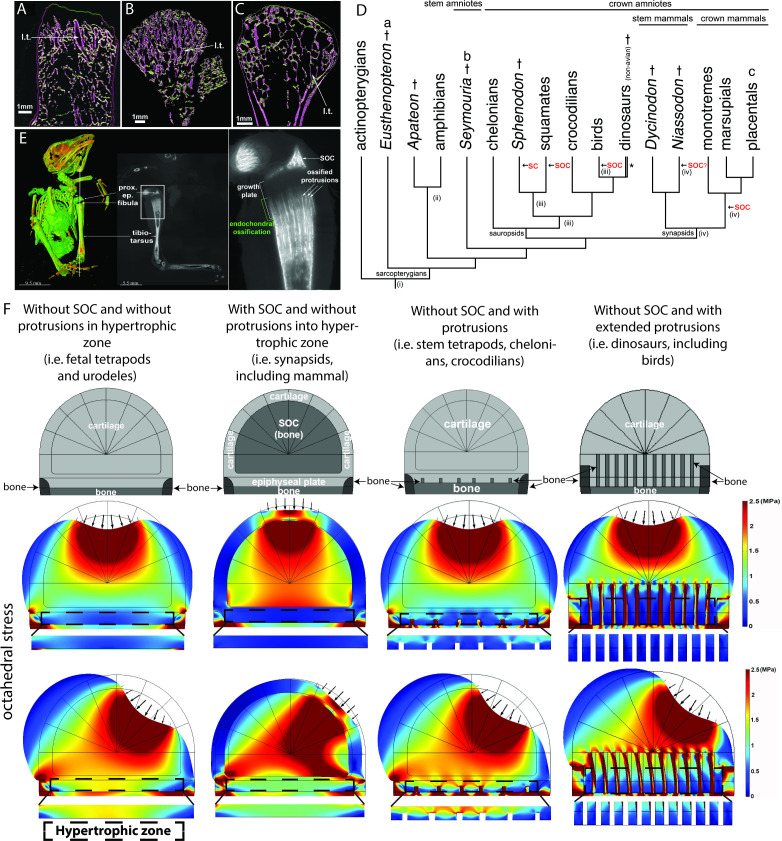
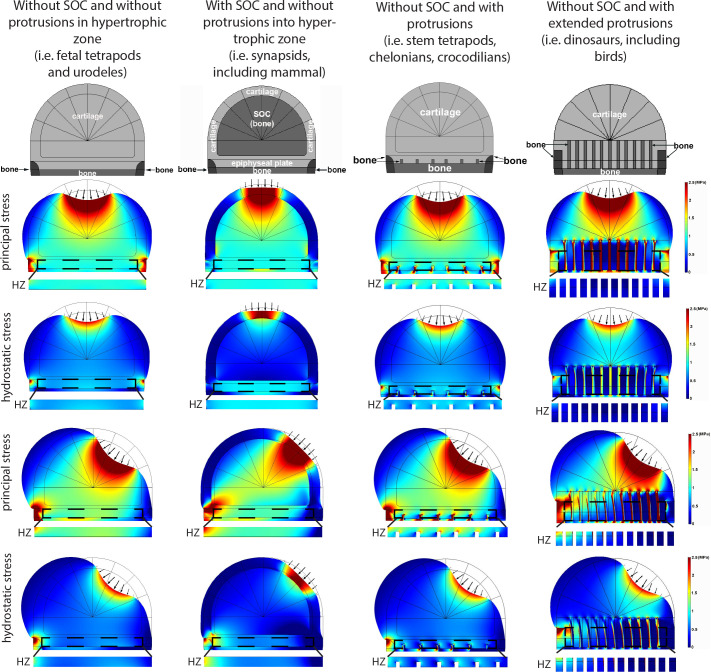
Figure 1. Evolutionary appearance of the SOC and its role in distributing octahedral stress.
(A–C) The proximal humeral metaphyses of Eusthenopteron (A), Seymouria (B), and Sciurus vulgaris (red squirrel) (C). The longitudinal trabeculae resulting from endochondral ossification at the base of the growth plate in adults are shown in pink, while the transverse trabeculae appear green. The longitudinal trabeculae (l.t.) are designated marrow processes invading the growth plate. (D) Phylogeny tree, illustrating the major changes in the evolution of long-bone epiphyses. The black arrows indicate the presence of a secondary calcified center (SC) or a secondary ossification center (SOC). (i) Estimated appearance of endochondral formation of long bones based on the fossil record to date; (ii) Cartilaginous epiphyses in long-bones; (iii) Hypothetical presence of an ancestral SCs in sauropsids; (iv) Hypothetical presence of an ancestral SOCs in synapsids. * indicates paraphyly within the group. (E) A synchrotron scan of a juvenile sparrow demonstrates the presence of SOC. 1, a virtual thin section of the proximal epiphysis. prox. ep., proximal epiphysis. (F) Deformation and distribution of octahedral stress from FEA simulation in different evolutionary taxa. Columns refer to (from left to right) ‘without SOC’ (representing i.e., fetal tetrapods and urodeles), ‘with SOC’ (representing i.e., synapsids including mammal), ‘stem tetrapods’ (representing i.e., juvenile stem tetrapods, chelonians, crocodilians), and archosaurs (representing i.e., birds and non-avian dinosaurs). For comparison of structural functionality, all situations used the same basic geometry and materials. The small arrows indicate the direction of loading. The supra-physiological loading level (3 MPa) was modeled. A hypertrophic zone free of bony elements is presented under each model for direct comparison.


