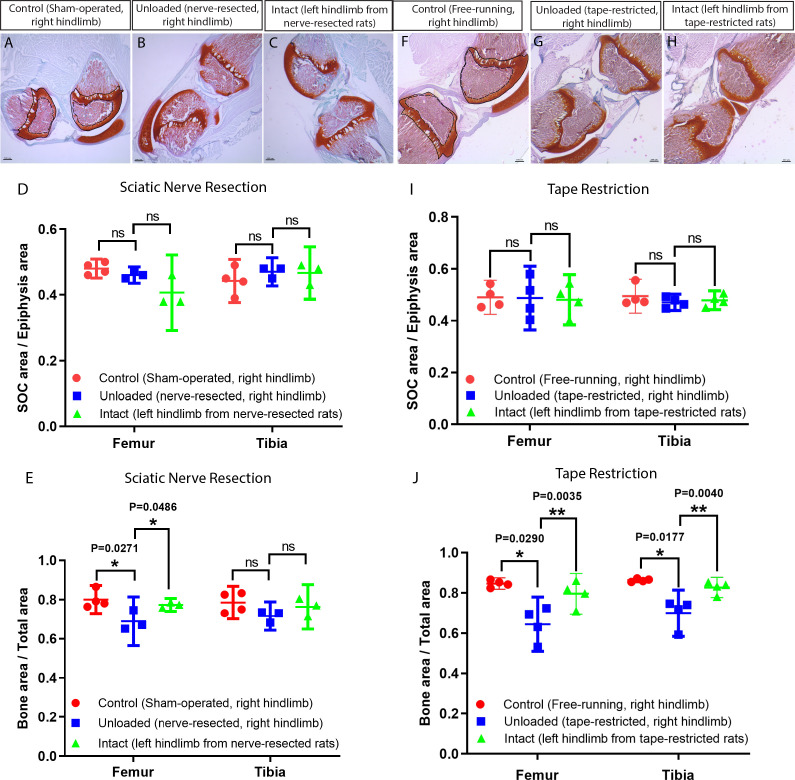
Figure 10. Unloading of the hindlimbs in growing rats by either sciatic nerve resection or by tape restriction.
Sciatic nerve resection (A–E) or leg restriction with a kinesiology tape (F–J) was done at 10 days of age and both hindlimbs (manipulated and intact) were analyzed at day 23. For (A–E) sham-operated littermates were used as a control (only right hindlimb was utilized), whereas for (F–J) unmanipulated littermates were used as a control (only right hindlimb was utilized). (A–C, F–H) Representative Safranin O and Fast Green stained images of the knee joint. Black dash lines outline the SOC and solid lines outline the epiphysis area in A and F. Quantification of SOC size (normalized to total epiphysis size) (D, I) and bone mass (within the primary spongiosa region) (E, J). Bars are means ±95% confidential interval and every dot represent an individual animal, two-tailed Student’s t-test. ns, not significant.


