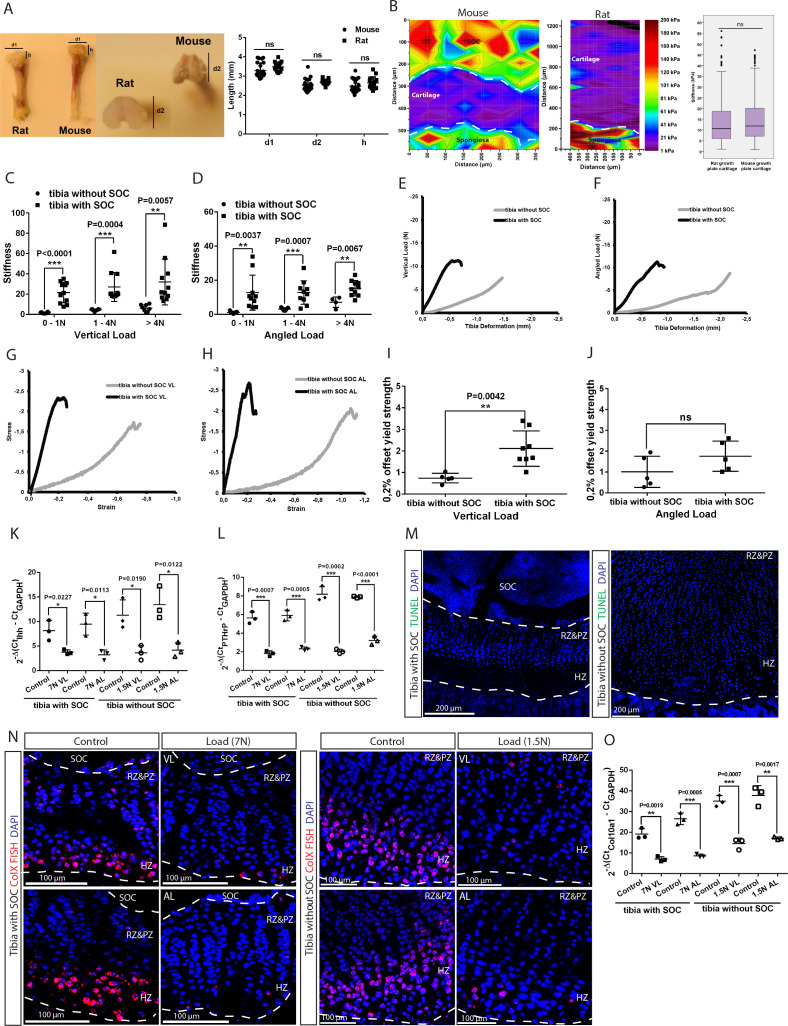
(A) Mouse (30-day-old) and rat (10-day-old) tibia with and without a SOC, respectively, have similar physical dimensions of the epiphyses (d1, d2, h). (B) Representative images and quantification of the nanoindentation test of 30-day-old mice and 10-day-old rats. (C–D) The stiffness of bones with fully developed SOCs (tibia with SOC) and with immature SOCs (tibia without SOC) was measured at different loads and in both the vertical (C) and angled (D) direction. (E–J) Representative load/deformation (E–F) and stress/strain (G–H) curves of vertically (VL) (E, G) and angularly (AL) (F, H) loaded tibias with and without SOCs. (I–J) The elasticity of tibias with and without SOCs under vertical (I) and angled load (J). (K–L) The QPCR analysis of Indian hedgehog (Ihh) (K) and parathyroid hormone-related peptide (PTHrP) (L) levels in the epiphyseal end of tibia with and without SOCs. (M) Representative images of growth plates of tibias with and without SOCs fixed after dissection and prior loading. TUNEL staining (green) and nucleus counterstaining with DAPI (blue). (N) Fluorescent in situ hybridization of collagen type X (ColX) in the loaded growth plates of tibias with and without SOCs. VL, vertical load, AL, angled load. RZ and PZ, resting zone and proliferative zones, HZ, hypertrophic zone. (O) QPCR analysis of ColX level in the epiphyseal end of tibia with and without SOCs exposed to different loading. Data are means ± SD, two-tailed Student’s t-test, except in (B) where Mann-Whitney U-test was used. In (A), n = 23 for ‘Mouse’ and n = 15 for ‘Rat’. In (B), n = 5 for ‘Mouse’ and n = 4 for ‘Rat’. In (C), n = 10 for ‘tibia with SOC’ at all loads; n = 9 for ‘tibia without SOC’ at 0–1N and 1–4N, n = 4 for>4N. In (D), n = 11 for ‘tibia with SOC’ at all loads; n = 8 for ‘tibia without SOC’ at all loads. In (I–L, O), n = 3. ns, not significant.


