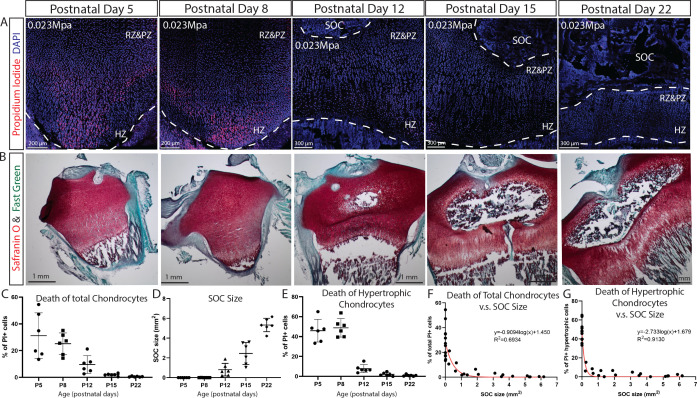
Figure 7. SOC size is negatively correlated with load-induced chondrocyte death in rat tibia growth plate.
(A) Representative images of the distribution of propidium iodide (PI)-positive cells in the growth plates of rat tibia with the same vertical pressure of 0.023 Mpa (equivalent to the load of 0.2N for postnatal day 5 rat tibia). (B) Representative images of safranin O and fast green staining of the corresponding rat tibia to illustrate the development of SOC. (C–E) Quantification of PI-positive total growth plate chondrocytes (C), SOC size (D) and PI-positive hypertrophic chondrocytes (E) in the loaded rat tibia at different ages. (F–G) Correlation analysis of PI-positive total growth plate chondrocytes (F) or PI-positive hypertrophic chondrocytes (G) with SOC size. Semilog line of nonlinear regression curve fit was used (red line). During the end of the culture period, bones were incubated with PI, which penetrates only into dead cells (red). DAPI (blue) counterstaining of all nucleus was done on the fixed tissue sections. RZ and PZ, resting zone and proliferative zones, HZ, hypertrophic zone. Data are means ± SD, n = 6. Two independent experiments were performed with three animals per time point per experiment. Each data point in (F–G) represents one animal.

