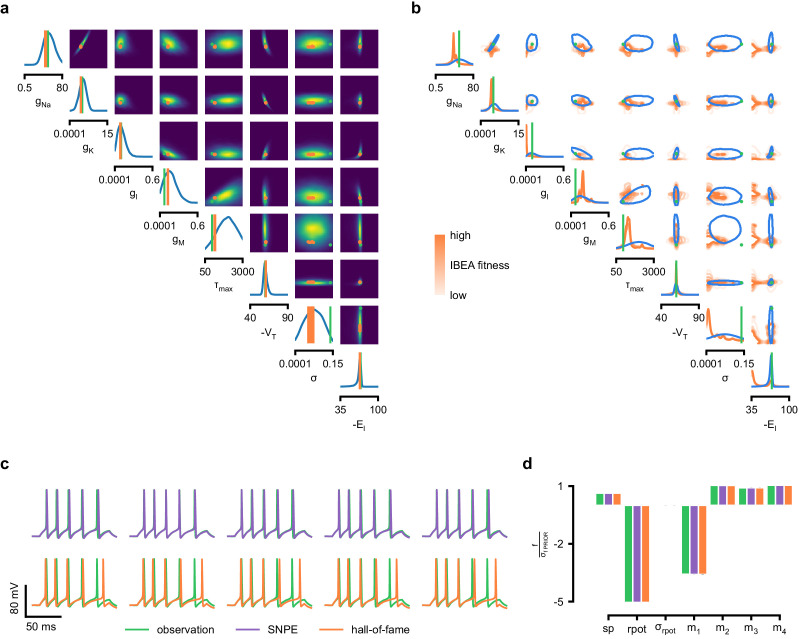
Appendix 1—figure 10. Comparison between SNPE posterior and IBEA samples for Hodgkin-Huxley model with 8 parameters and 7 features.
(a) Full SNPE posterior distribution. Ground truth parameters in green and IBEA 10 parameters with highest fitness (‘hall-of-fame’) in orange. (b) Blue contour line corresponds to 68% density mass for SNPE posterior. Light orange corresponds to IBEA sampled parameters with lowest IBEA fitness and dark orange to IBEA sampled parameters with highest IBEA fitness. This plot shows that, in general, SNPE and IBEA can return very different answers– this is not surprising, as both algorithms have different objectives, but this highlights that genetic algorithms do not in general perform statistical inference. (c) Traces for samples with high probability under SNPE posterior (purple), and for samples with high fitness under IBEA objective (hall-of-fame; orange traces). (d) Features for the desired output (observation), the mode of the inferred posterior (purple) and the best sample under IBEA objective (orange). Each voltage feature is normalized by , the standard deviation of the respective feature of simulations sampled from the prior.

