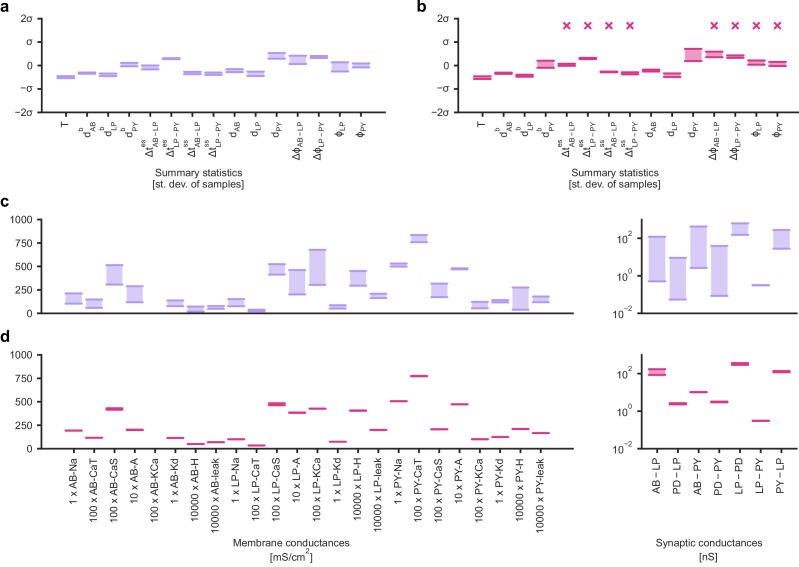
Appendix 1—figure 12. Identifying directions of sloppiness and stiffness in the pyloric network of the crustacean stomatogastric ganglion.
(a) Minimal and maximal values of all summary statistics along the path lying in regions of high posterior probability, sampled at 20 evenly spaced points. Summary statistics change only little. The summary statistics are z-scored with the mean and standard deviation of 170,000 bursting samples in the created dataset. (b) Summary statistics sampled at 20 evenly spaced points along the orthogonal path. The summary statistics show stronger changes than in panel a and, in particular, often could not be defined because neurons bursted irregularly, as indicated by an ‘x’ above barplots. (c) Minimal and maximal values of the circuit parameters along the path lying in regions of high posterior probability. Both membrane conductances (left) and synaptic conductances (right) vary over large ranges. Axes as in panel (d). (d) Circuit parameters along the orthogonal path. The difference between the minimal and maximal value is much smaller than in panel (c).

