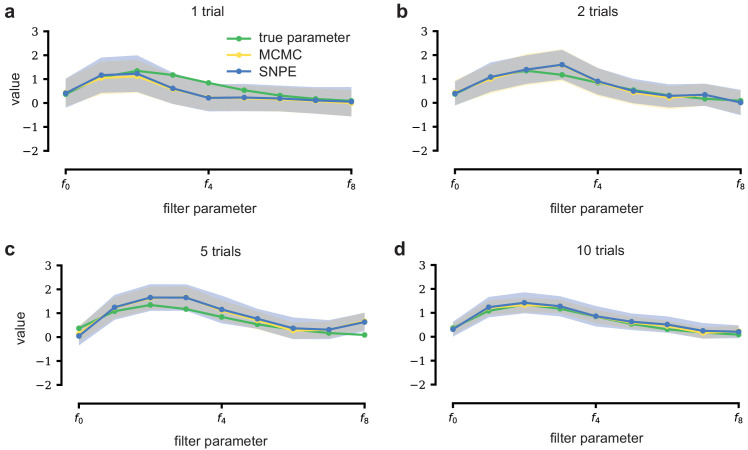
Appendix 1—figure 3. LN model with additional data.
With additional data, posterior samples cluster more tightly around the true filter. From left to right and top to bottom, SNPE (blue) and MCMC (yellow, for reference) are applied to observations with more independent Bernoulli trials, leading to progressively tighter posteriors and posterior samples closer to the true filter (which is the same across panels). Mean ± one standard deviation is shown. Note that SNPE closely agrees with the MCMC reference solution in all cases (a-d).

