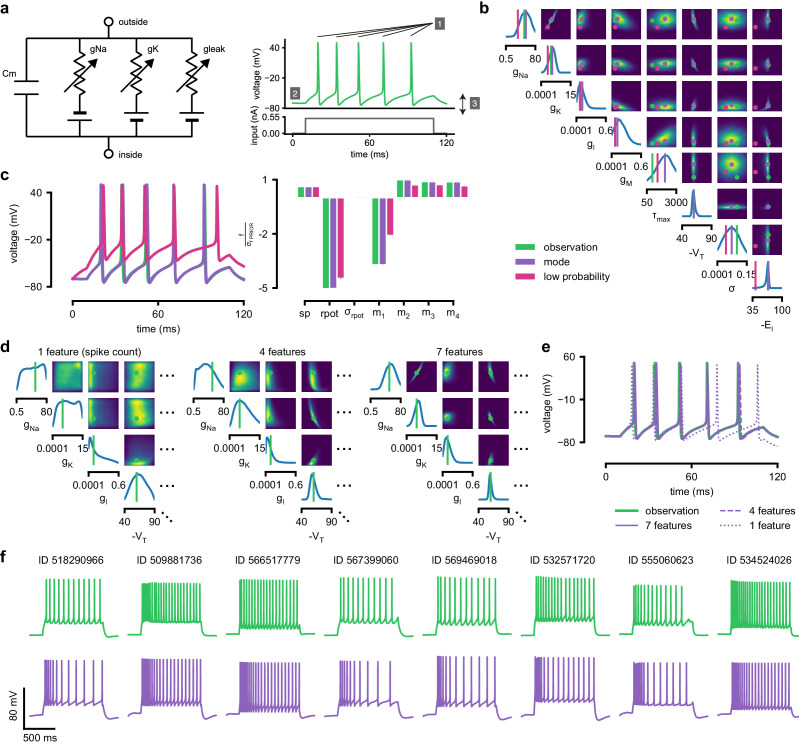
Figure 4. Inference for single compartment Hodgkin–Huxley model.
(a) Circuit diagram describing the Hodgkin–Huxley model (left), and simulated voltage-trace given a current input (right). Three out of 7 voltage features are depicted: (1) number of spikes, (2) mean resting potential, and (3) standard deviation of the pre-stimulus resting potential. (b) Inferred posterior for 8 parameters given seven voltage features. Ground truth parameters in green, high-probability parameters in purple, low-probability parameters in magenta. (c) Traces (left) and associated features f (right) for the desired output (observation), the mode of the inferred posterior, and a sample with low posterior probability. The voltage features are: number of spikes , mean resting potential , standard deviation of the resting potential , and the first four voltage moments, mean , standard deviation , skewness and kurtosis . Each value plotted is the mean feature ± standard deviation across 100 simulations with the same parameter set. Each feature is normalized by , the standard deviation of the respective feature of simulations sampled from the prior. (d) Partial view of the inferred posteriors (4 out of 8 parameters) given 1, 4 and 7 features (full posteriors over eight parameters in Appendix 1—figure 8). (e) Traces for posterior modes given 1, 4 and 7 features. Increasing the number of features leads to posterior traces that are closer to the observed data. (f) Observations from Allen Cell Types Database (green) and corresponding mode samples (purple). Posteriors in Appendix 1—figure 9.

