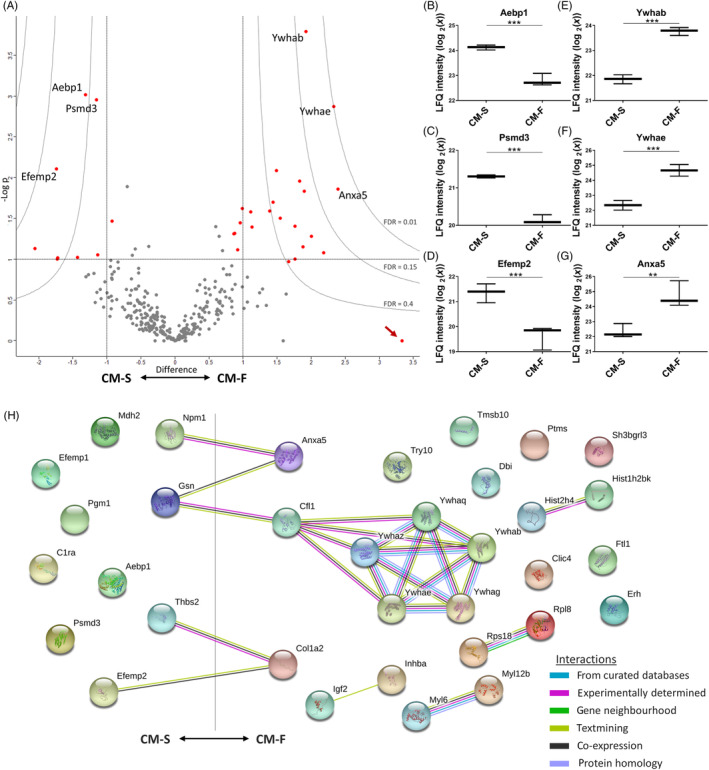
FIGURE 4.

Quantifying differences between the static and dynamic osteocyte secretome. A, Volcano plot, illustrating upregulation with flow to the right and downregulation to the left. The y‐axis displays the ‐log10 of P value, where the horizontal line corresponding to a P value of .1. Vertical lines indicate a log2 fold change of ±1. Curves illustrate indicated FDR values with S0 parameter set to 2. B‐D, Whisker plots of three significantly upregulated proteins and E‐G significantly downregulated proteins in the presence of fluid flow are indicated. The arrow indicates a protein which displays low significance due to being present in only one of the CM replicates. H, String DB network illustrating interactions between mechanically regulated proteins, with significant degree of protein‐protein interaction (P < 10‐3). CM, conditioned medium; FDR, false discovery rate
